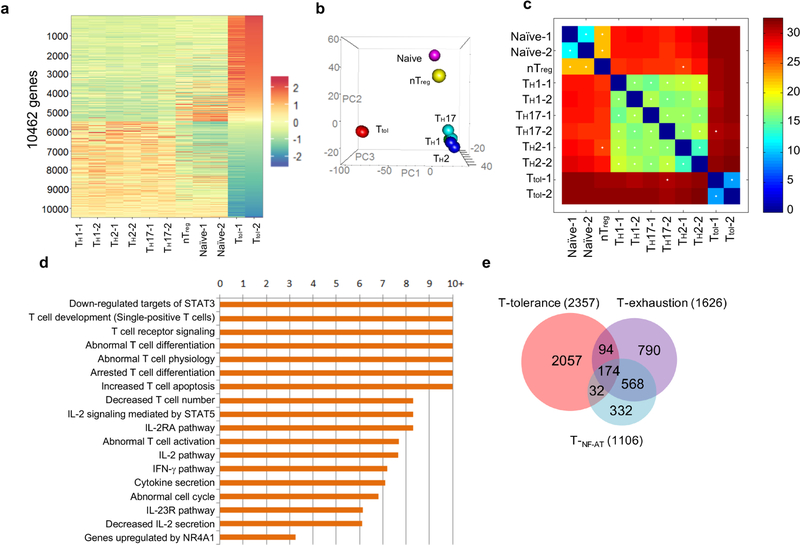
Extended Data Fig. 1. Comparison of gene expression profiles among CD4+ T cell subsets including Ttol, TH1, TH2, T H17, nTreg, naive T, TNF-AT and Texh cells.
a, Hierarchical clusters for six groups of CD4+ T cells. The colour coding indicates the expression level of 10,462 genes, with 0 as the median. All of the samples, except nTreg cells, were duplicated. b, Hierarchical clustering and principal component analysis of six types of CD4+ T cells (Ttol , naive, TH1, TH2, TH17 and nTreg). n = 2 (naive, TH1, TH2, TH17 and Ttol); n = 1 (nTreg). c, Correlation analysis of CD4+ T cell subsets using a k shared nearest neighbours classification algorithm. d, Ingenuity pathway analysis (IPA) of differentially expressed genes in Ttol cells, with twofold as the cut-off. e, Venn diagram comparison of Ttol cell-relevant genes with TNF-AT cell-and Texh cell-relevant genes.

