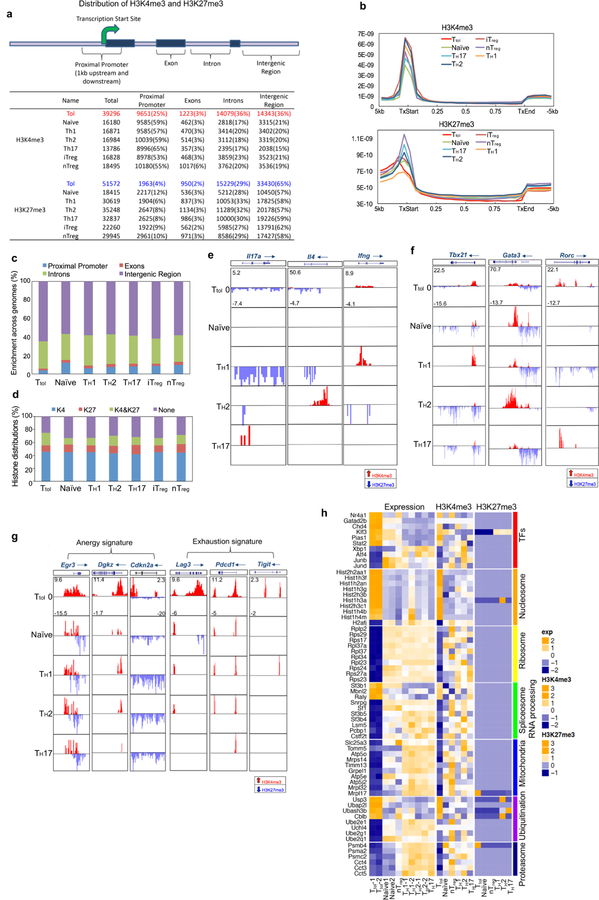
Extended Data Fig. 2. Distribution of H3K4me3 and H3K27me3 peaks in mouse CD4+ T cells.
a, Summaries of H3K4me3 and H3K27me3 peaks in mouse CD4+ T cells including Ttol, TH1, TH2, TH17, nTreg, iTreg and naive T cells. The mouse genome (mm9) is divided into four regions: promoter (1 kb upstream and downstream of the TSS), exon, intron and intergenic regions. For each sample, the total number of identified islands is listed, followed by the number of islands for each genomic region (with the percentage of the total). b, Distribution of H3K4me3 and H3K27me3 modifications within gene bodies in mouse CD4+ T cells. TxStart, start of transcription; TxEnd, end of transcription. c, Comparison of global distribution of H3K27me3 modifications at promoter, exon, intron and intergenic regions among different T cell subsets. d, Percentage of genes associated with H3K4me3 alone (K4), H3K27me3 alone (K27), both H3K4me3 and H3K27me3 (K4&K27), or neither (None), for each T cell subset as indicated. e, H3K4me3 and H3K27me3 histone modifications across the Ifng, Il4 and Il17a gene loci in indicated T cell subsets. f, Genome-wide H3K4me3 and H3K27me3 histone modifications across the gene loci for three master transcription factors (Tbx21, Gata3 and Rorc) for indicated T cell subsets. g, H3K4me3 and H3K27me3 histone modifications across the T cell-anergy-related genes Egr3, Dgkz and Cdkn2a, and the T cell-exhaustion-related genes Lag3, Pdcd1 and Tigit, for indicated T cell subsets. h, H3K4me3 and H3K27me3 modifications as well as gene expression profiles were normalized separately with GeneSpring software. Hierarchical clusters of gene modules of transcription factors, nucleosomes, ribosomes, spliceosome/RNA processing, mitochondria, ubiquitination and proteasome are shown. The colour coding depicts the normalized value for each gene based on the following scales: expression (−2 to +2), H3K4me3 (−2 to +3) and H3K27me3 (−1 to +3), with 0 as the median.

