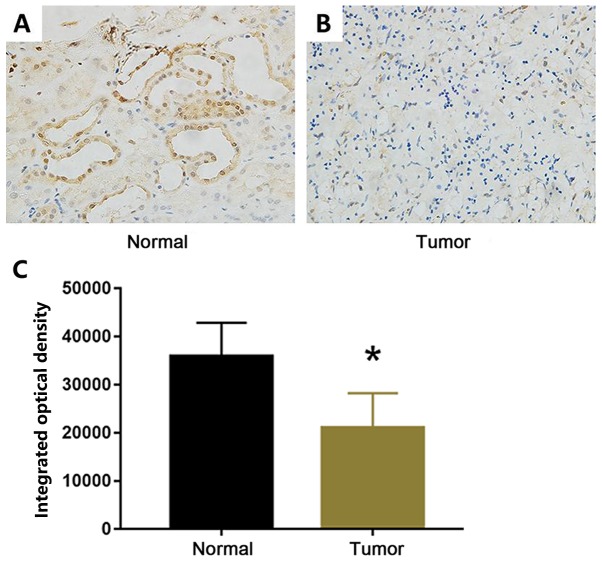
Figure 2.
Immunohistochemical analysis of TUSC3 expression. (A and B) Immunohistochemical staining of TUSC3 in normal kidney tissues and clear cell renal cell carcinoma tissues (magnification, ×400). (C) Quantitative analysis of immunohistochemical images. *P<0.01 vs. normal. TUSC3, tumor suppressor candidate 3.

