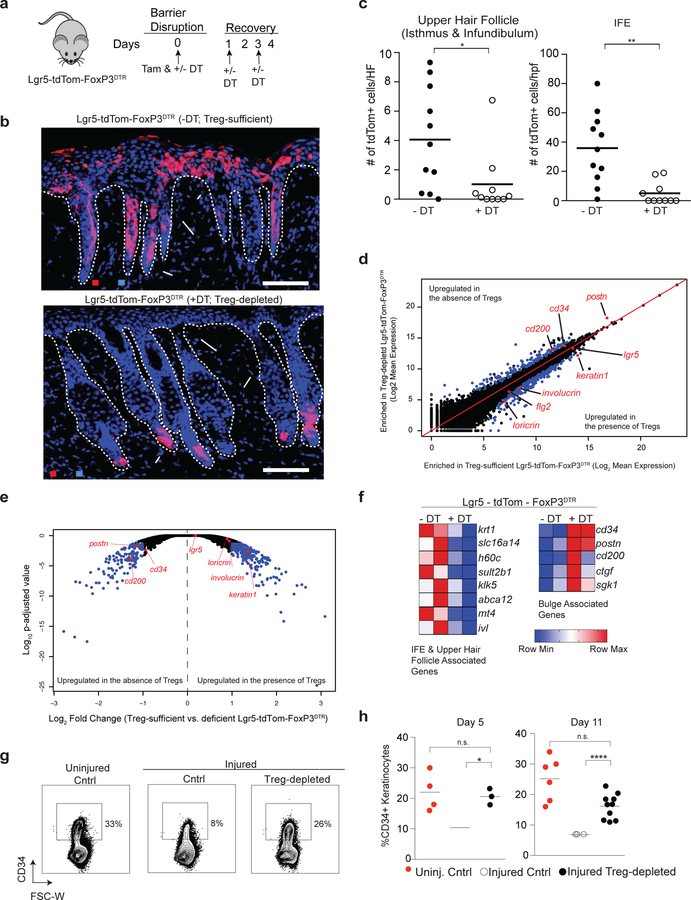
Figure 4. Treg cells facilitate HFSC migration and differentiation during epidermal regeneration.
(a) Schematic showing DT and tamoxifen (Tam) administration in Lgr5-tdTom-FoxP3DTR mice during skin barrier recovery for experiments described in panels b-f. Mice are compared to tamoxifen-labeled, non-DT treated littermates and harvested 4 days after skin barrier disruption.
(b) Representative images demonstrating the patterns of stem cell progeny (tdTomato+ cell) localization in the skin of tamoxifen-labeled, Lgr5 stem cell lineage tracing mice after injury. Mice are either sufficient (-DT) or depleted (+DT) of Treg cells. (c) Quantification of Lgr5-derived cell (tdTomato+) localization in the upper hair follicle (isthmus and infundibulum; left panel) and IFE (right panel). tdTomato+/ HF and tdTomato+/hpf represent cell numbers normalized per hair follicle and per high power field respectively. See also Supplementary Figure 4.
(d) FACS purified tdTom+ cells from DT-treated (i.e. Treg cell-depleted) or untreated Lgr5-tdTom-FoxP3DTR (i.e. Treg cell-sufficient) mice were analyzed by RNA-sequencing. Comparison plots of normalized gene expression of tdTomato+ cells isolated from Treg cell-sufficient and Treg cell-depleted Lgr5-tdTom-FoxP3DTR mice. Blue dots represent genes with a p-adjusted value < 0.05 and > 2-fold difference in gene expression between groups.
(e) Volcano plot comparing the p-adjusted value versus fold change for tdTomato+ cells isolated from Treg cell-sufficient and Treg cell-deficient Lgr5-tdTom-FoxP3DTR mice. Blue dots represent genes with a p-adjusted value < 0.05 and > 2 fold differences in gene expression between groups.
(f) Heat map of gene transcripts of tdTomato+ cells isolated from Treg cell-sufficient and Treg cell-depleted Lgr5-tdTom-FoxP3DTR mice focusing on differentially expressed genes with a padj. value < 0.05, fold change differences > 2 and predominant expression in either the bulge or IFE/upper hair follicle in adult mice.(Joost et al., 2016)
(g) Cntrl and FoxP3DTR mice were treated as diagramed in Figure 1a and compared to uninjured WT mice. Representative plots of CD34+ cells in the epidermis 11 days after epidermal injury. Plots are pre-gated on live, CD45-negative epidermal cells.
(h) Percentage of CD34+ epidermal cells in uninjured cntrl mice compared to barrier-disrupted cntrl and Treg cell-depleted mice 5 and 11 days after injury. See also Supplementary Figure 5.
For all relevant panels, error bars are +/− SEM. *p < 0.05; **p < 0.01; **** p<0.0001 by Student’s t-test or by one-way ANOVA for panel h. Results in b-c are representative of > 8 independent experiments (n=2 to 4 mice per group); d-f are representative of 2 independent experiments (n=2 mice per group) Results of h (right panel) are pooled data from 3 independent experiments. (n=2–4 mice per group) and representative of 2 experiments (left panel). Scale bar in b is 100 µm; Red-tdTomato+ Lgr5 stem cell progeny; Blue – DAPI.

