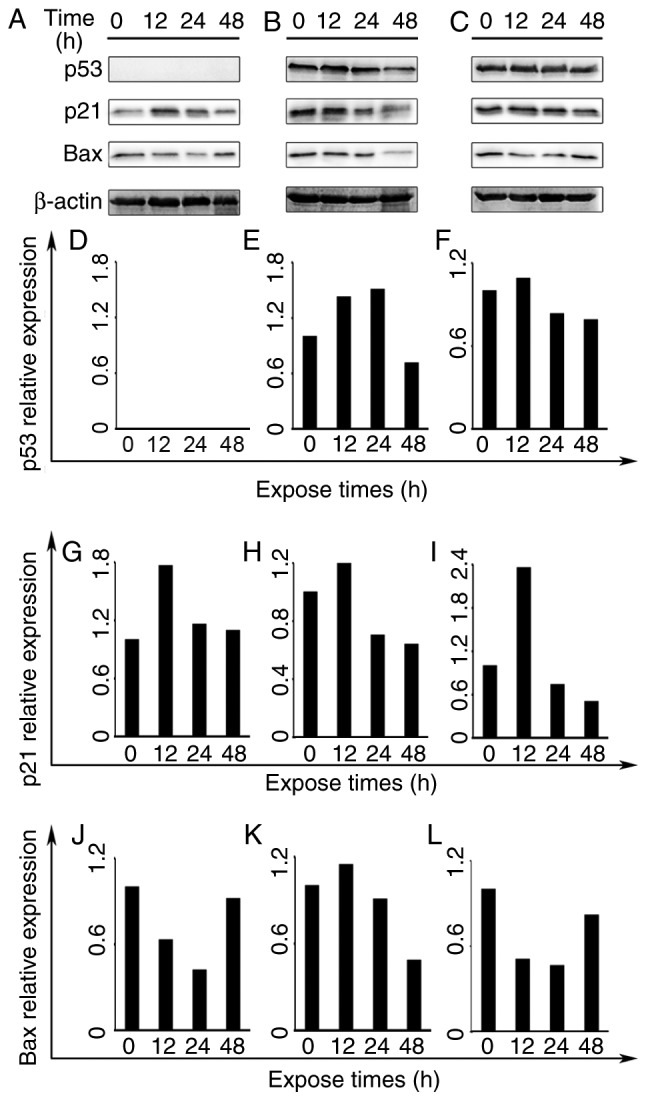
Figure 5.

The expression of apoptosis-associated proteins in treated breast cancer cell lines. (A) MCF-7, (B) MDA-MB-468 and (C) MDA-MB-231 cells treated with 0.5× IC50 frullanolide for 12, 24 and 48 h. The bar charts represent the relative expression of (D-F) p53, (G-I) p21 and (J-L) Bax proteins at the indicated times in all frullanolide treated-breast cancer cell lines. Bax, B cell lymphoma 2 associated X protein; IC50, half-maximal inhibitory concentration.
