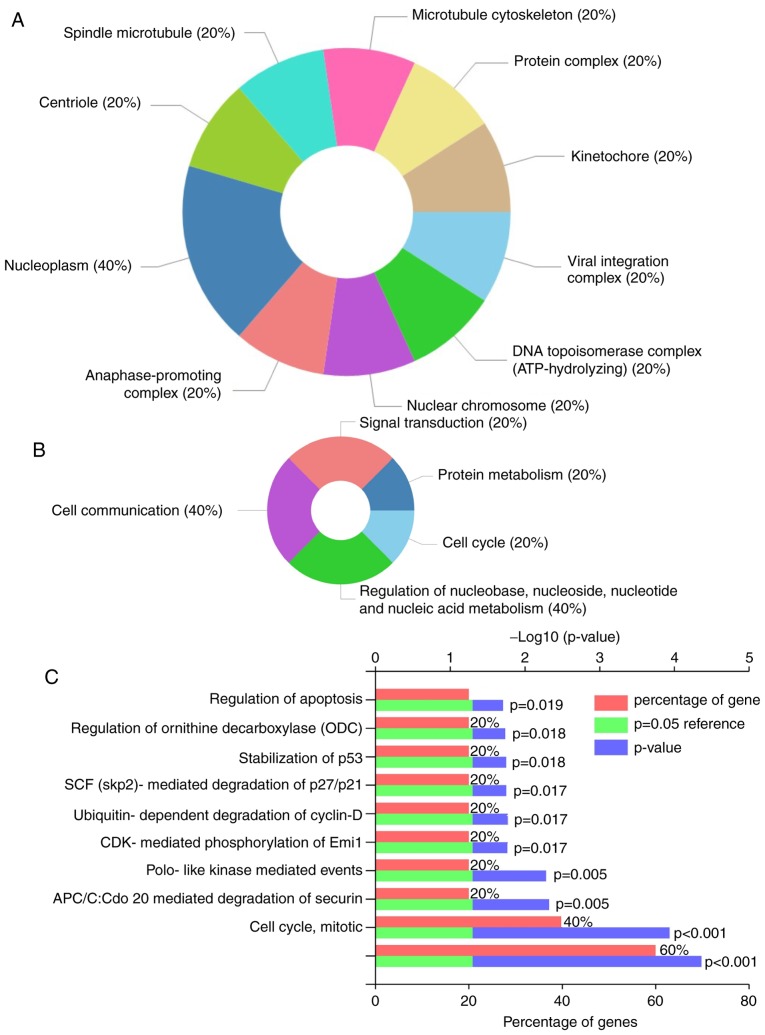
Figure 2.
Functional enrichment analysis of DEGs. Charts of DEGs enriched for (A) cellular components, (B) biological processes and (C) molecular functions in Gene Ontology analysis using the online tool Database for Annotation Visualization and Integrated Discovery and Funrich software. P<0.05 was considered to indicate a statistically significant difference. DEGs, differentially expressed genes.

