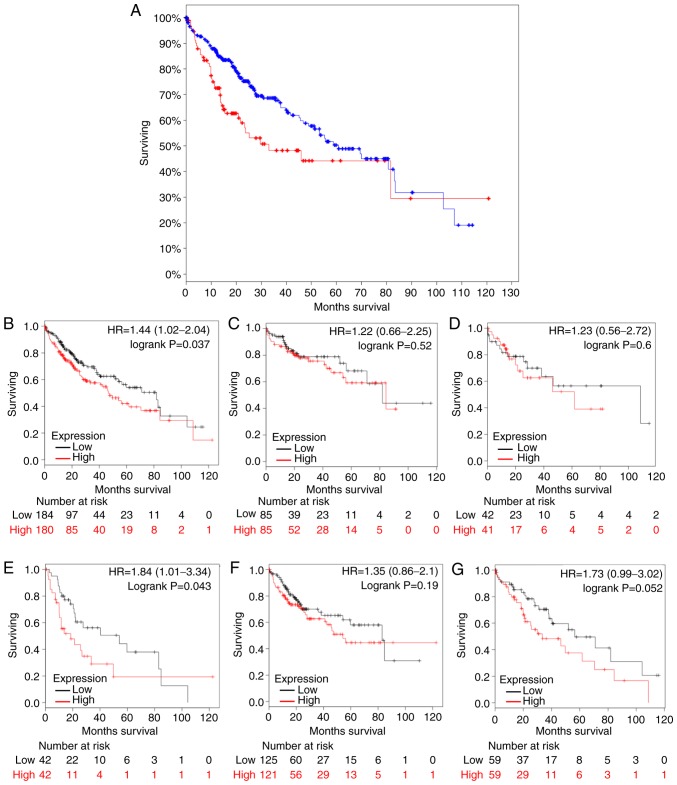
Figure 5.
Kaplan-Meier estimator analysis of candidate genes in patients with HCC. (A) Kaplan-Meier plots patients with HCC with five differentially expressed genes (UBE2C, topoisomerase II α, pituitary tumor transforming gene 1, glypican-3 and polycomb-repressive complex 1) overexpression with data recruited from cBioPortal (P=0.0127). The blue line represents HCC patients with relatively low UBE2C, TOP2A, PTTG1, GPC3 and PRC1 mRNA expression, and the red line represents HCC patients with high expression of the aforementioned genes. Log-rank analysis revealed that patients with HCC and high mRNA expression exhibited significant short survival times. (B-G) Kaplan-Meier plots of different clinicopathological features associated with UBE2C overexpression. The black line represents UBE2C low expression and the red line represents UBE2C overexpression. The X and Y axes indicate survival rate and overall survival time (days), respectively. (B) All patients. (C) Patients in clinical stage I. (D) Patients in clinical stage II. (E) Patients in clinical stage III. (F) Male and (G) female patients with HCC. Log-rank analysis revealed that patients with HCC in clinical stage III with high UBE2C mRNA expression exhibited significantly lower survival times compared with patients with low UBE2C mRNA expression. Log rank P-value and 95% confidence intervals of the hazard ratio were used for statistical analysis. HCC, hepatocellular carcinoma; mRNA, messenger RNA; UBE2C, ubiquitin-conjugating enzyme 2C.

