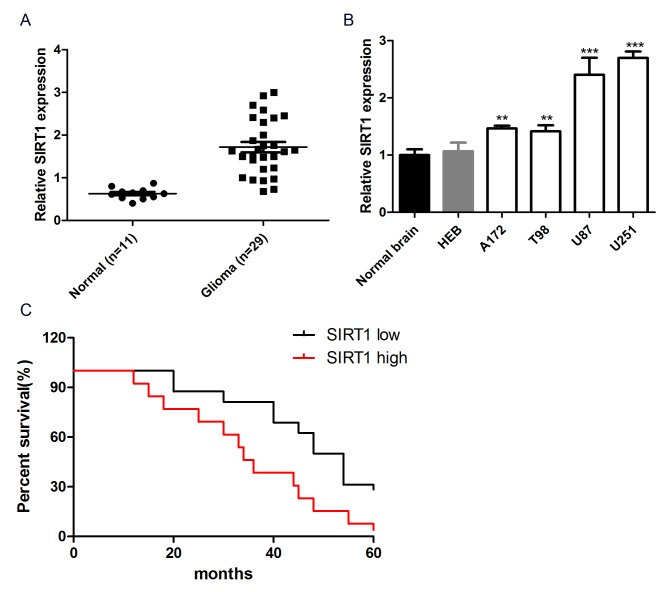
Figure 1.
SIRT1 expression is upregulated in glioma tissues and cell lines. (A) The expression of SIRT1 was detected in human glioma tissues and adjacent non-tumor tissues using RT-qPCR. (B) The expression of SIRT1 in U87, U251, A172, T98 and HEB cell lines and normal brain tissue was detected using RT-qPCR. (C) The Kaplan-Meier survival curve of patients with glioma was created based on the expression levels of SIRT1 protein. **P<0.001 and ***P<0.001 compared with normal brain tissues. RT-qPCR, reverse transcription-quantitative polymerase chain reaction; SIRT1, sirtuin 1.

