Figure 1.

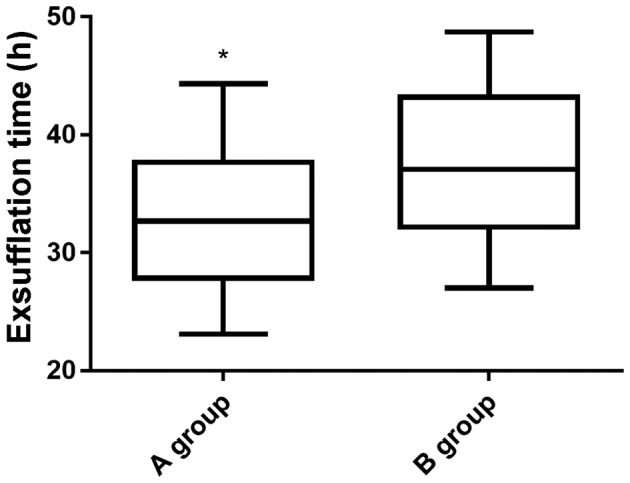
Comparison of the first exhaust time after operation between the two groups. Independent samples t-test was used to analyze the first exhaust time. The first exhaust time in group A was significantly lower than that in group B (*P<0.05).

Comparison of the first exhaust time after operation between the two groups. Independent samples t-test was used to analyze the first exhaust time. The first exhaust time in group A was significantly lower than that in group B (*P<0.05).