Figure 4.
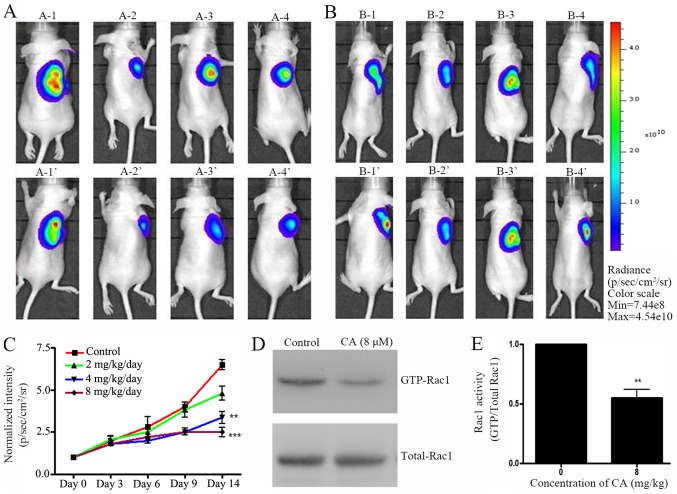
CA exhibits antitumor growth effects in vivo. A549 cells (2×10⁶) were subcutaneously injected into the right flanks of NOD/SCID mice (n=60). After two weeks, 30 mice which developed tumors were randomly assigned into several groups and were treated with various concentration of CA (0, 2, 4 or 8 mg/kg/day) for 14 days (intraperitoneal injection). (A) A-1-A-4: IVIS imaging results from 4 representative mice prior to CA injection in treatment group. A-1′-A-4′: IVIS imaging of the same mice following 14 days treatment with CA. (B) B-1-B-4: IVIS imaging results from 4 representative mice prior to DMSO injection in control group. B-1′-B-4′: IVIS imaging of the same mice following 14 days treatment with DMSO treatment. (C) Quantification of IVIS fluorescence intensity. n=6. *P<0.05, **P<0.01, ***P<0.001 vs. control group. After IVIS observation, mice were sacrificed and tumor tissues were collected to evaluate Rac1 activity. (D) Rac1-GTPase activity was measured by glutathione-S-transferase pull-down and subsequently western blotting. (E) Quantification of GTP-Rac1 level shown in (D), normalized by total Rac1. n=3. **P<0.01 vs. the 0 µM control group (0 µM). CA, corosolic acid; Rac1, Ras-related C3 botulinum toxin substrate 1.

