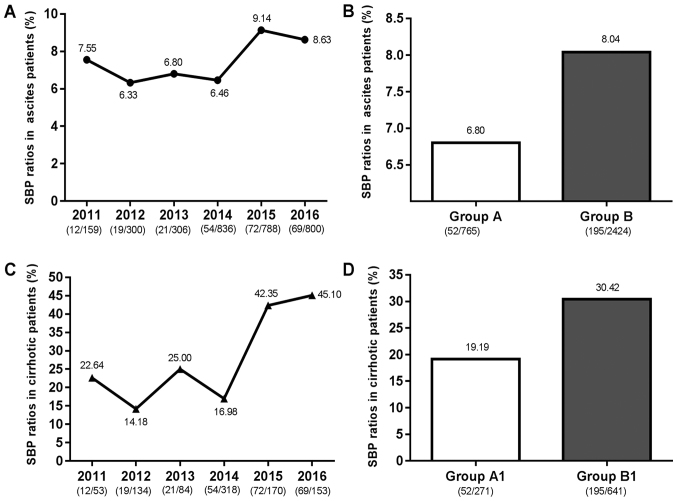
Figure 1.
SBP ratios in ascites patients and cirrhotic patients. (A) SBP ratios in ascites patients from 2011 to 2016; (B) SBP ratios in ascites patients in Group A and Group B; (C) SBP ratios in cirrhotic patients from 2011 to 2016; (D) SBP ratios in cirrhotic patients in Group A1 and Group B1. Groups: A, ascites patients admitted between 2011 and 2013; B, ascites patients admitted between 2014 and 2016; A1, liver cirrhosis patients with ascites admitted between 2011 and 2013; B1, liver cirrhosis patients with ascites admitted between 2014 and 2016. SBP, spontaneous bacterial peritonitis.

