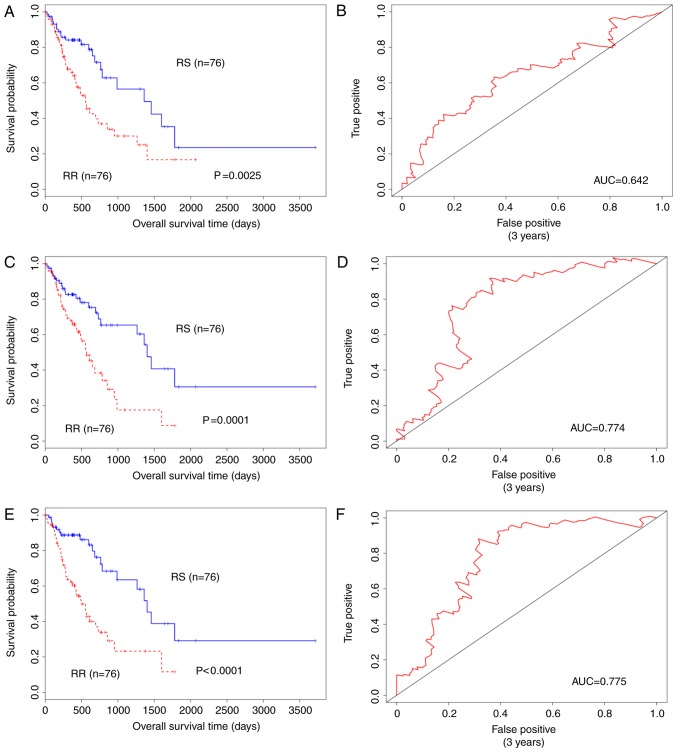
Figure 2.
Survival analysis and ROC curve for estimating the radiosensitivity gene signature effect in the prognosis of oesophageal cancer patients. (A) Survival curve of the 10-gene signature PI in TCGA oesophageal cancer patients. (B) ROC curve of the 10-gene signature PI. (C) Survival curve of the 31-gene signature PI in TCGA oesophageal cancer patients. (D) ROC curve of the 31-gene signature. (E) Survival curve of the combination genes (41-gene signature) PI in TCGA oesophageal cancer patients. (F) ROC curve of the 41-gene signature PI. ROC, receiver operator characteristic; PI, prognostic index; TCGA, The Cancer Genome Atlas; RS, radiosensitive; RR, radioresistant; AUC, area under the curve.

