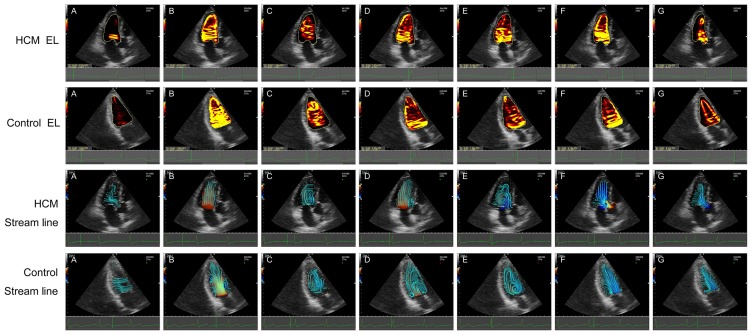
Figure 3.
Changes of LVEL and stream line in a complete cycle were shown respectively in HCM group and control group. (A) P0 indicated the IVR time at which time the flow was 0; (B) P1 indicated rapid filling time at which the filling flow time was up to maximum; (C) P2 indicated the slow filling phase where the flow was at minimum value; (D) P3 indicated the atrial contraction time of late diastole at which the flow time was peak value; (E) P4 indicated IVC time when the flow was at 0; (F) P5 indicated the rapid ejection time at which the systolic ejection flow time reached the peak value; and (G) P6 indicated the slow ejection time. LVEL, energy loss of left ventricle; IVR, isovolumic relaxation; IVC, isovolumic contraction; HCM, hypertrophic cardiomyopathy.

