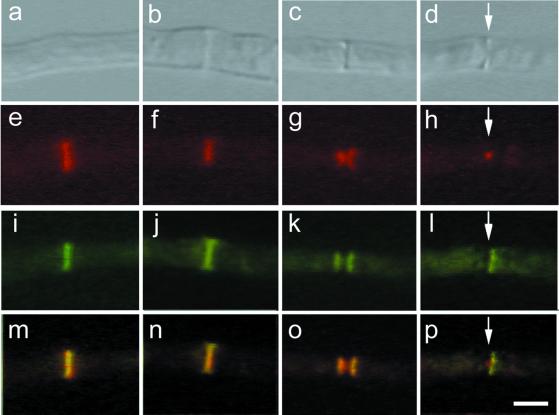
Figure 2.
Localization of AspB and actin during septation. Differential interference contrast images (row 1, top); actin localization with Texas Red-conjugated secondary antibody (row 2); AspB localization with fluorescein isothiocyanate-conjugated secondary antibody (row 3); and merger of rows 2 and 3 (row 4). Areas of AspB and actin colocalization appear yellow. Arrows indicate location of septum. (a, e, i, and m) Early stage of septum formation. No cross-wall is visible yet. (b, c, f, g, j, k, n, and o) Intermediate stages of septum formation. (d, h, l, and p) Late stage of septum formation. Bar, 5 μm.

