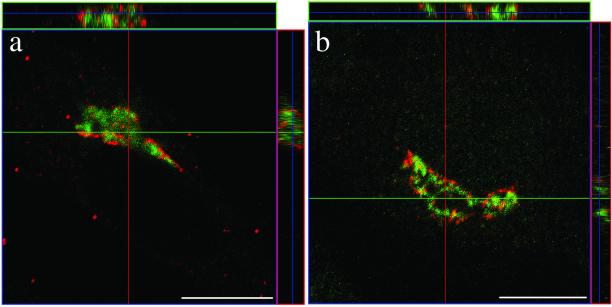
Figure 2.
GBF1 and BIG1 are recruited to different compartments of the Golgi complex. (a) BHK-21 cells were transiently transfected with a plasmid encoding HA-tagged full-length BIG1 and processed for IF by using antibodies against the HA epitope (3F10/fluorescein) and GBF1 (H154/Texas Red). (b) NRK cells were fixed and processed for IF by using antibodies against GBF1 (H154/Alexa594) and BIG1 (Alexa488-conjugated 9D3). Both images (a and b) were obtained by collecting stacks of optical sections (3.2 μm in thickness for BHK-21 cell [a] and 2.0 μm for NRK cell [b]) by using a confocal microscope. Shown in the center is an X-Y slice. Above and to the right are slices through the stack that reveal the distribution in the X-Z and Y-Z planes at the position indicated by the magenta and green lines, respectively. Bars, 10 μm. Similar results were obtained from at least three independent experiments.

