Figure 6.
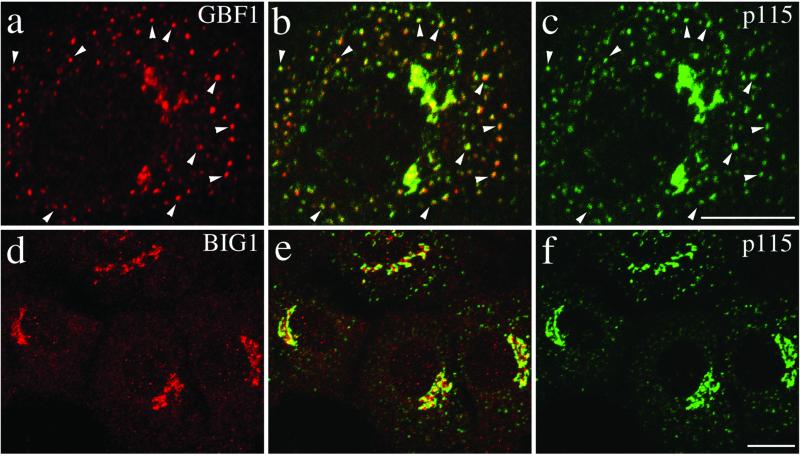
GBF1, but not BIG1, redistributes from the Golgi complex to peripheral VTCs at 15°C. NRK cells incubated for 2 h in a 15°C water bath before fixation were processed for double-label IF by using monoclonal antibodies against p115 and polyclonal antibodies that recognize either GBF1 (a–c) or BIG1 (d–f). To better reveal small peripheral structures, projections of several confocal slices are shown. Middle panels (b and e) show superimposed left and right images. As indicated by arrowheads in images a–c, the peripheral GBF1 and p115 staining patterns are almost identical. Peripheral structures appear as either yellow or orange dots depending on the relative intensity of red and green signals. The apparent partial overlap between BIG1 and p115 in perinuclear area shown in image e is due to the overexposure of perinuclear signals to better display small peripheral structures. Bars, 10 μm. The distinct response to temperature shift for GBF1 and BIG1 was observed in each of at least three separate experiments.

