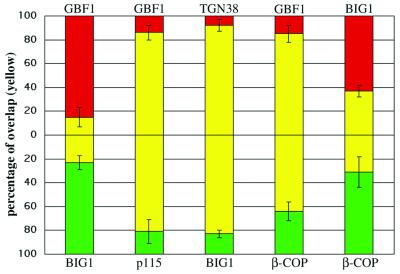
Figure 9.
Quantitative analysis of the distribution of ARF-GEFs relative to Golgi markers and coat proteins. The extent of overlap observed in the perinuclear area by using antibodies to the indicated proteins was measured as described in MATERIALS AND METHODS. The percentage of IF signal intensity present in shared pixels (yellow) relative to total signal was measured for both the red (top) and green (bottom) channels. Red and green only values were defined as the difference between 100% and the overlap measured for the corresponding channel. Red signal was obtained by staining with polyclonal anti-GBF1 or anti- BIG1, whereas green signal was obtained with monoclonal anti-p115, anti-β-COP, or Alexa488-conjugated polyclonal anti-BIG1 (see legends of Figures 2, 3, and 8 for details). The number of separate images used for quantitation was five for GBF1/p115, four for TGN38/BIG1, five for GBF1/BIG1, six for GBF1/β-COP, and six for BIG1/β-COP. Error bars correspond to the SD of the mean.

