Fig. 3.

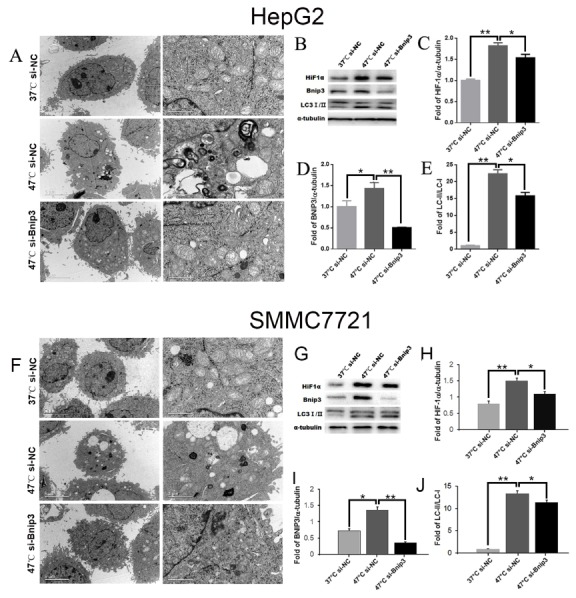
The results of the electron microscope and the western blotting. (A, F) The results of the electron microscope. (B–E, G–J) The expression of HIF-1α, BNIP3, LC3-I/LC3-II and the western blotting. *P < 0.01 and **P < 0.001.

The results of the electron microscope and the western blotting. (A, F) The results of the electron microscope. (B–E, G–J) The expression of HIF-1α, BNIP3, LC3-I/LC3-II and the western blotting. *P < 0.01 and **P < 0.001.