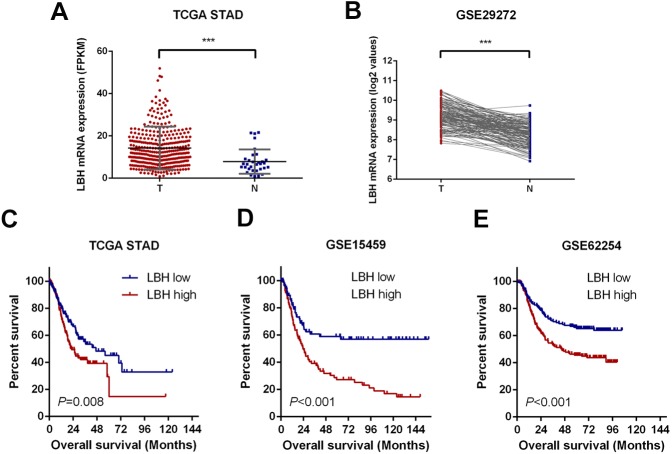
Figure 1. LBH is upregulated in gastric cancer tissues and correlates with poor survival.
(A) Dot plots represent LBH expression levels in gastric cancer tissues (n = 375) and normal gastric tissues (n = 32) according to the data from the TCGA-STAD cohort. P value was determined using Student’s t-test. Error bars represent mean ± s.d., *** P < 0.001. (B) LBH expression in paired normal (N = 134) and GC tissues (N = 134) in GSE29272 cohort. P value was determined using Student’s t-test. *** P < 0.001. (C–E) LBH expressions were associated with overall survival in the gastric cancer patients. (C) Data was retrieved from TCGA-STAD cohort. The number of subjects in LBH high (top 50%) and low (bottom 50%) were n = 187 and n = 188. P = 0.008 by log-rank test. (D) Data was retrieved from the GSE15459 cohort. The number of subjects in LBH high (top 50%) and low (bottom 50%) were n = 96 and n = 96. P < 0.001 by log-rank test. (E) Data was retrieved from the GSE62254 cohort. The number of subjects in LBH high (top 50%) and low (bottom 50%) were n = 150 and n = 150. P < 0.001 by log-rank test.

