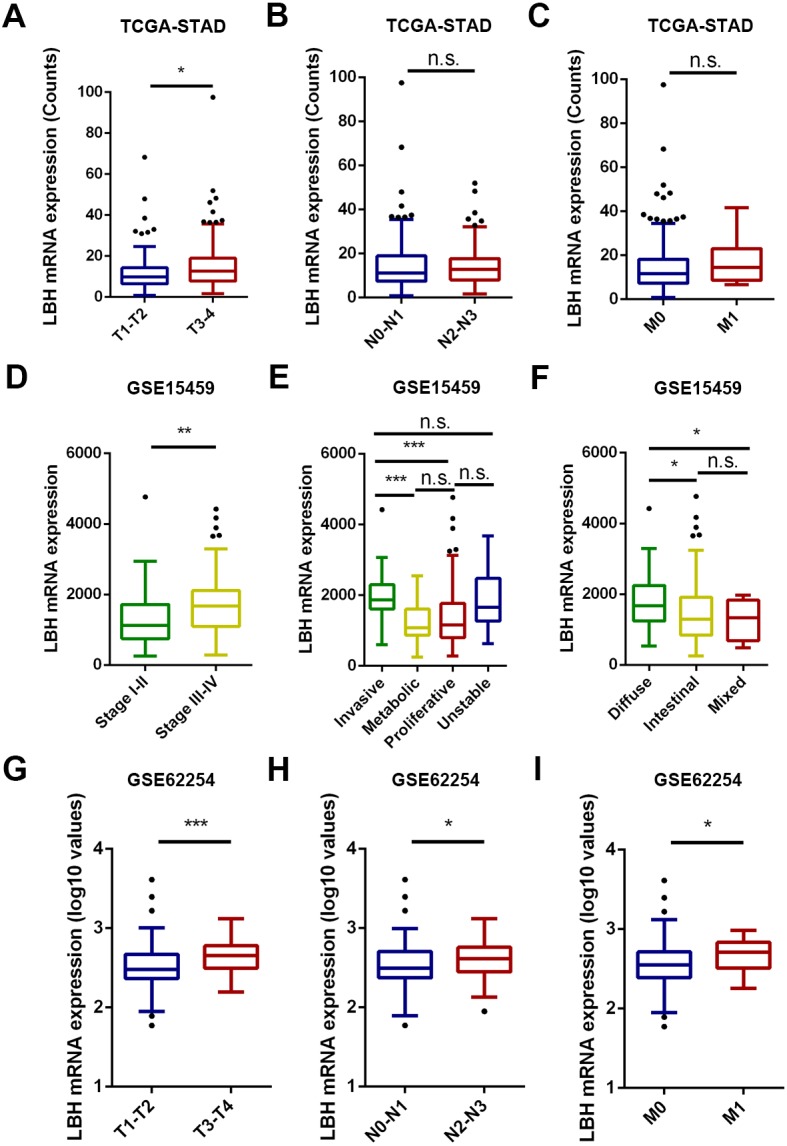
Figure 2. The box and whisker plot (tukey style, outliers in black dots) represent the expression patterns of LBH mRNA in GC predicted by bioinformatics.

(A–C) LBH mRNA was significantly upregulated in T3-T4 than in T1-T2 sample (A). LBH mRNA was not significantly changed with N and M stage (B–C). (D–F) The LBH mRNA was dramatically more abundant in stage III-IV (left panel), invasive subtype (E) and diffused Lauren classification (F) in GSE15459 cohort. (C) The LBH increased from early T stage (G), N stage (H) and M stage (I) to the late T, N, M stage in GSE62254. P value was determined using Student’s t-test. * P < 0.05, ** P < 0.01, *** P < 0.001, n.s., not significant.
