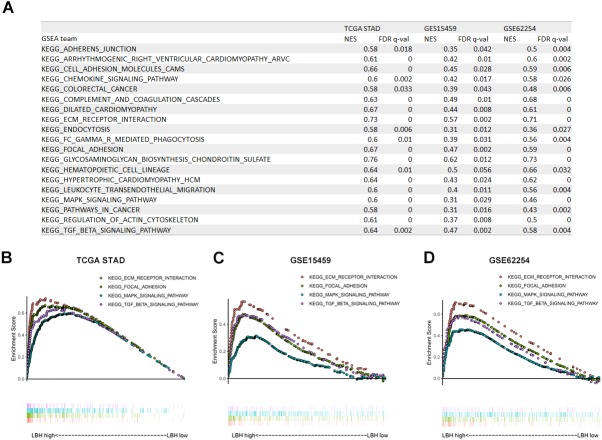
Figure 5. Gene Set Enrichment Analysis (GSEA) result of LBH in three independent datasets.
(A) GSEA terms that are significantly enriched in TCGA-STAD, GSE15459 and GSE62254. (B–D) KEGG pathway, named “KEGG_ECM_RECPTOR_INTERACTION”, “KEGG_FOCAL_ADHENSION”, “KEGG_MAPK_SIGNAL_PATHWAY” and “KEGG_TGF_BETA_SIGNAL_PATHWAY” was enriched in TCGA-STAD(B), GSE15459(C) and GSE62254(D) cohort. The position of the color bars indicates the ordering of the differential genes relative to other genes. The colored dots indicate the strength of the enriched genes under high LBH conditions (left) or low LBH conditions (right).

