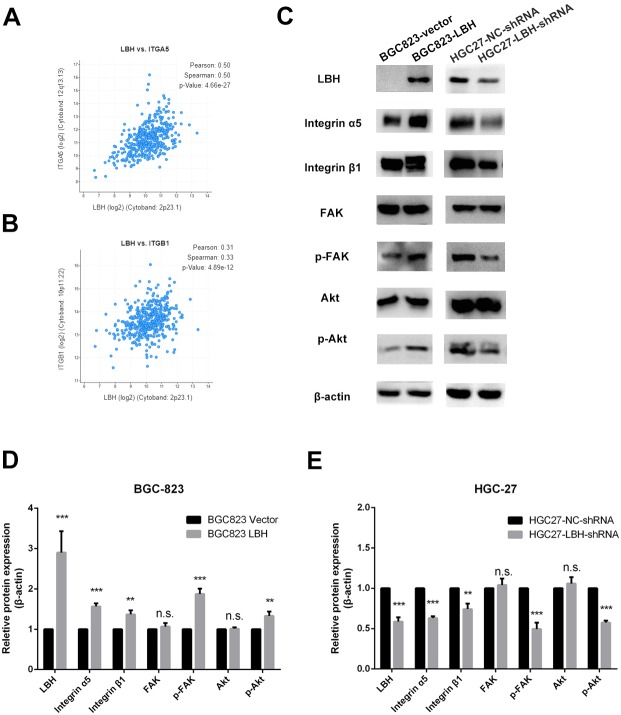
Figure 7. The effect of LBH on integrin α5 β1/FAK/Akt pathway.
(A) The expression of LBH (x) and ITGA5 (y) in GC. Analysis was performed with cBioPortal on the provisional TCGA datasets. (B) The expression of LBH (x) and ITGB1 (y) in GC. Analysis was performed with cBioPortal on the provisional TCGA datasets. (C) The effect of LBH overexpression or knockdown on protein level of key Integrin/FAK/Akt pathway markers by western blot. Each experiment was repeated three times. (D–E) Actin bands represent equivalence in protein loading. The optical densities of each protein band were measured using ImageJ software. Student’s t-test was used for statistical analysis. Data are expressed as mean ±s.d. Differences are considered significant at * P < 0.05; ** P < 0.01; *** P < 0.001.

