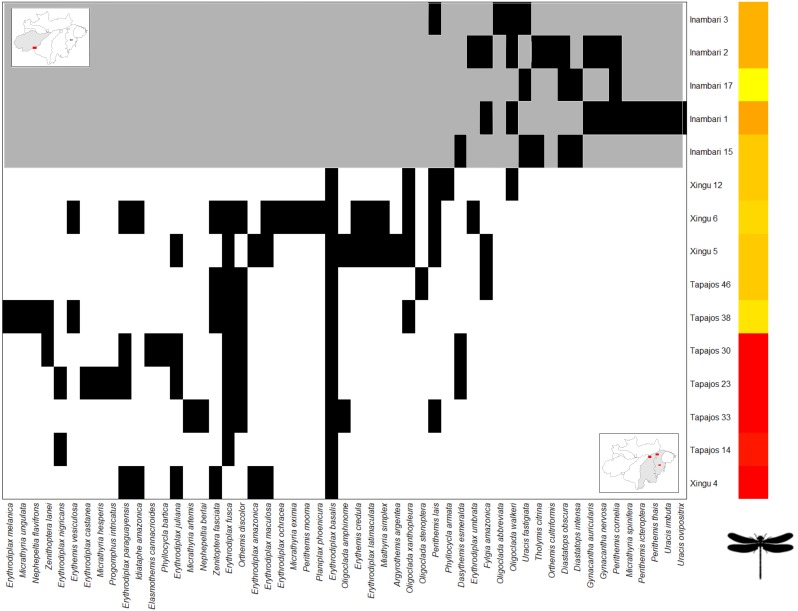
Figure 5. Clementsian pattern of Anisoptera metacommunities ordered by temperature –the variable that showed the greatest magnitude of difference between observed and expected matrices (Z).
Sites are depicted on rows and species on columns. Black squares indicate species occurrences; in the Clementsian pattern, particular species groups appear in different compartments.

