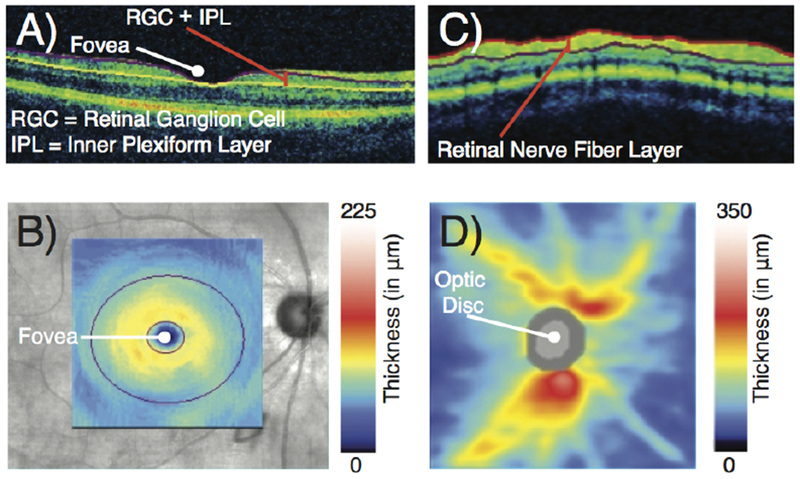
Figure 3:

Optical coherence tomography. (A) Tomogram through the fovea shows the ganglion cell complex layer, which is comprised of the retinal ganglion cell layer and the inner plexiform layer. (B) Thickness of the ganglion cell complex layer. (C) Circular tomogram around the optic disc shows the retinal nerve fiber layer. (D) Thickness of the retinal nerve fiber layer.
