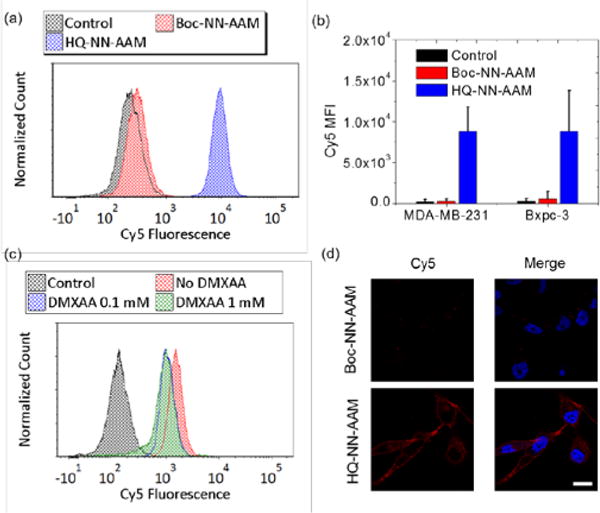
Figure 3.

HQ-NN-AAM metabolic labelled cells. a) Flow cytometry histogram of metabolic labeling of HQ-NN-AAM (50 μM) and Boc-NN-AAM (50 μM) in MDA-MB-231 cells. b) Quantification of azido labeling in MDA-MB-231 cells and Bxpc-3 cells c) Flow cytometry histogram of metabolic labeling of HQ-NN-AAM (50 μM) with co-incubation of DTD inhibitor in MDA-MB-231 cells. d) Confocal image of HQ-NN-AAM and Boc-NN-AAM treated MDA-MB-231 cells. Azido groups were labeled with DBCO-Cy5 (red) for visualization. Nucleus were stained with Hoechst dye (blue). Scale bar = 20 μM
