Figure 1.

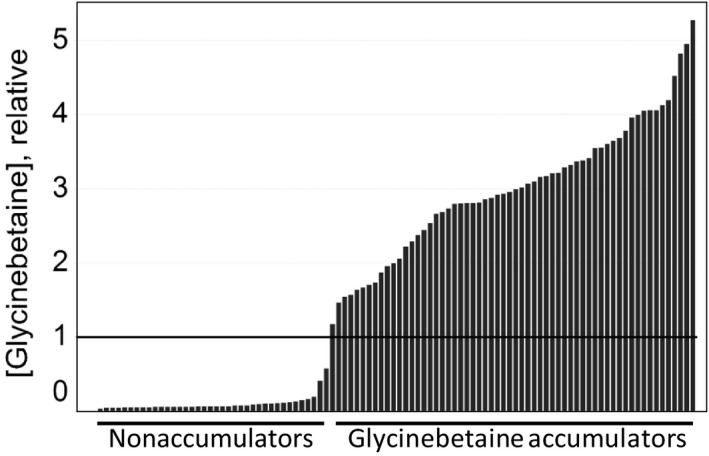
Maize genotypes divide into two GB phenotypic classes. Relative GB concentration in leaves for 98 genotypes used in the gene expression experiment is shown in rank order. Each bar represents the mean of 10 replicates, and the relative GB concentration was estimated as the ratio of GB peak area per internal standard peak area. One unit of [GB] is taken as the threshold distinguishing GB accumulators and nonaccumulators
