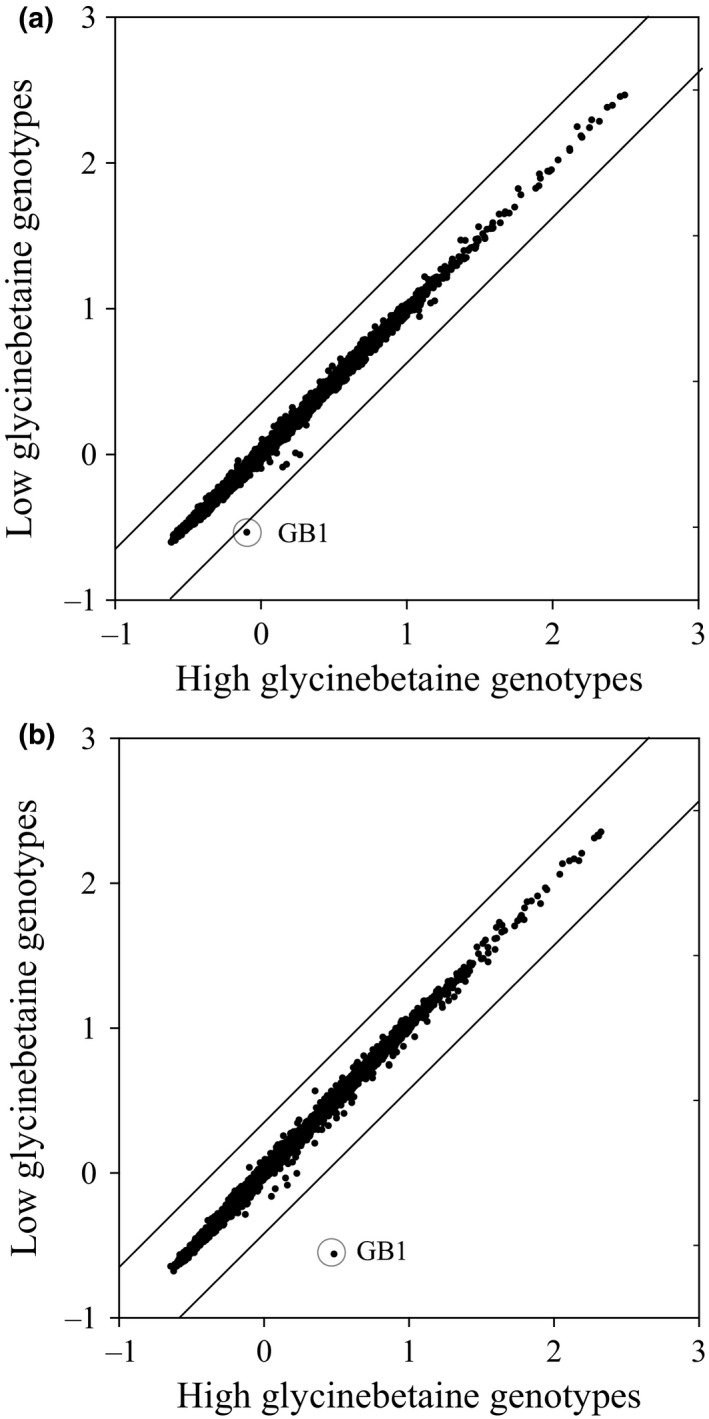
Figure 2.

The GB1 gene is differentially expressed in H‐GB maize genotypes. Each panel reports the difference in gene expression between high and low GB genotypes for irrigated (a) and drought (b) conditions. Log‐transformed array element hybridization signal intensity of each replication was normalized by subtracting the median of the noncontrol elements. Average signal values were calculated for high and low GB genotype classes and the difference between classes is presented in the scatter plot. The diagonal lines delimit the twofold difference in gene expression between the two GB classes. The differential signal for the GB1 element is circled
