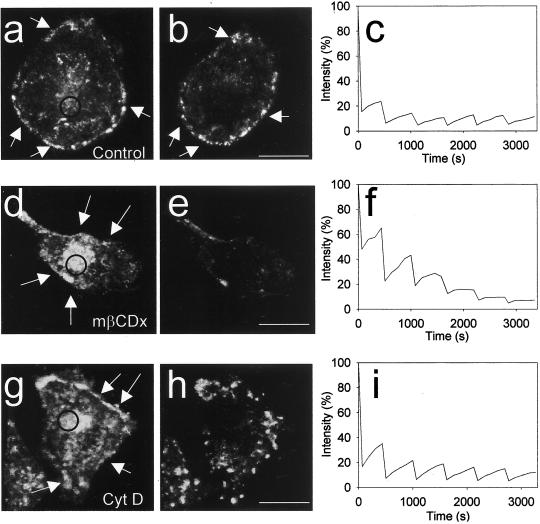
Figure 3.
4D FLIP analysis of GFP- cav–expressing cells treated with cyclodextrin and cytochalasin. (a and b) 3D reconstructions of a GFP-cav-1 β-expressing HeLa cell immediately before the first of six bleachings (the bleach region is indicated with a circle), and by the end of the experiment, after ∼60 min. (c) Fluorescence intensity of the bleach region. Note that very little fluorescence diffuses into the bleach region after the first bleaching and that the appearance of caveolae (arrows in a and b) is largely unchanged even after 1 h. (d and e) A parallel experiment, in which 10 mM methyl-β-cyclodextrin was added 10 min before the first bleaching. See 4D movie Figure 3, d and e, in the online version. (f) Fluorescence intensity of the bleach region is shown. Note that caveolin here diffuses faster into the bleach region than in the control and that caveolae (arrows in d) disappear over time. (g and h) Experiment in which 10 μg/ml cytochalasin D was added 10 min before the first bleaching. See 4D movie Figure 3, g and h, in the online version. (i) Fluorescence intensity of the bleach region. Note that the normal caveolar pattern (arrows in g) is changed after cytochalasin treatment and that the fluorescence moves into the bleach region more efficiently than in the control. Bars, 20 μm.

