Figure 4.
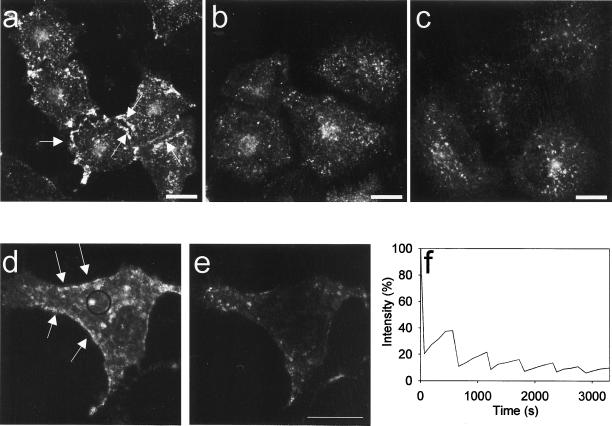
3D reconstruction and 4D FLIP analysis of GFP-cav–expressing cells stimulated with okadaic acid. (a) 3D reconstruction of a control HeLa cell expressing GFP-cav-1 β, showing distinctly labeled caveolae (arrows). (b) GFP-cav-1 β-expressing HeLa cells stimulated for 1 h with 1 μM okadaic acid. Endocytosis of caveolae is seen. (c) Endocytosis of caveolae in GFP-cav-1 β-expressing HeLa cells treated for 1 h with 1 μM okadaic acid in 1.6× hypertonic medium. (d and e) 3D stacks from the beginning and the end of a FLIP experiment in which okadaic acid was added 10 min before the first bleaching. Distinct GFP-labeled cavolae are shown by arrows in d. These caveolae became internalized and were bleached within 1 h (e) because they readily moved into the bleach region (f). Bars, 20 μm.

