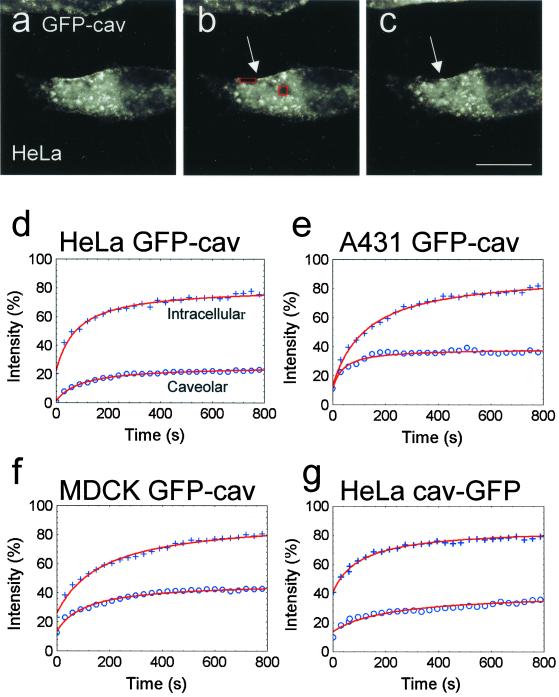
Figure 7.
FRAP analysis of intracellular and caveolae-associated GFP-cav. (a–c) Bleach regions selected as in Figure 6 on a GFP-cav-1 β transfected HeLa cell. The two bleach regions are shown before bleaching (a), immediately after bleaching (b), and at the end of the experiment, after ∼15 min (c). See movie Figure 7, a–c, in the online version. Note that the strongly fluorescent caveolar rim adjacent to the peripheral bleach region (arrows in b and c) appears unchanged during the experiment. (d–g) Curve fits of mean values of fluorescence intensities in the bleach regions of fluorescent intracellular structures and caveolae, respectively, within the first 800 s, obtained from 9 to 14 cells per experiment (+, intracellular fluorescence; o, caveolar fluorescence). Values have been normalized (% of prebleach values). It is seen that for all cell types and fusion proteins, the intracellular recovery is much more efficient than the caveolar recovery. Bar, 20 μm.

