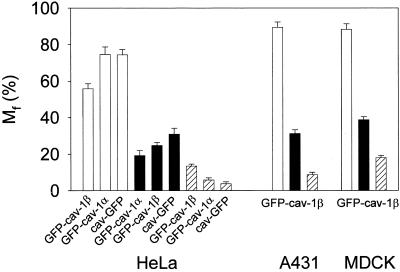
Figure 8.
Mobile fractions (Mf) of intracellular and caveolae-associated caveolin fusion proteins. Mf values for GFP-cav-1 β and cav- GFP, calculated for t = ∞, are based on the curve fits shown in Figure 7. The values for GFP-cav- 1 α are based on similar curve fits. Mf for intracellular fluorescent structures are shown with open bars, and for caveolae-associated fluorescence with filled bars. Moreover, Mf values for caveolae- associated GFP-cav-1 β and cav-GFP, based on the micro- FRAP experiments shown in Figure 9, as well as from micro- FRAP experiments with GFP-cav-1 α in HeLa cells, have been included (hatched bars). SD is indicated by error bars.

