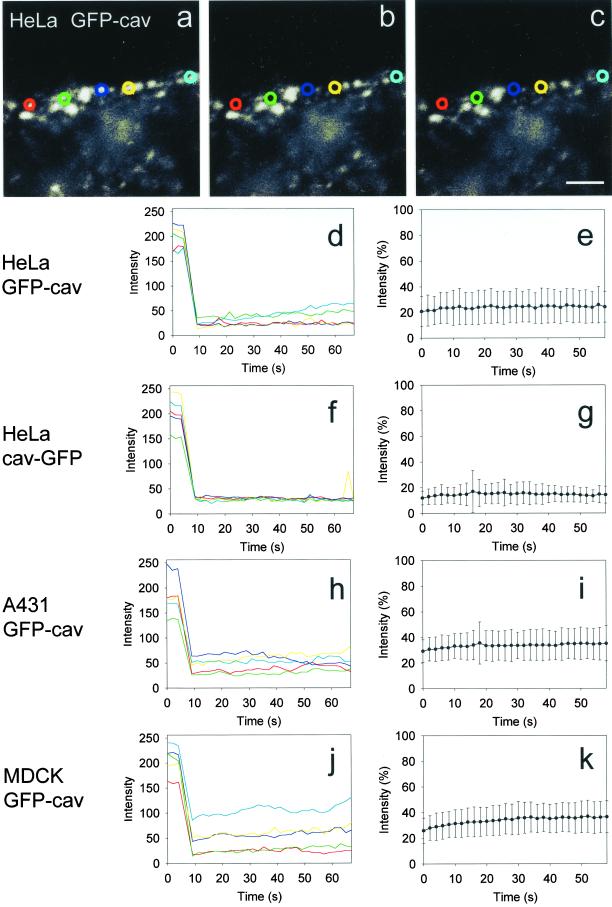
Figure 9.
Micro-FRAP analysis of caveolae- associated GFP-cav and cav-GFP. (a–c) Five small bleach regions, indicated with different colors, were placed on the peripheral, fluorescent caveolar rim of a GFP-cav-1 β- transfected HeLa cell. The first image (a) represents the prebleach situation, the next image (b) the situation immediately after bleaching, and the last one (c) the end of the experiment after 1 min. See 4D movie Figure 9, a–c, in the online version. (d, f, h, and j) Absolute fluorescence intensities for the experiment with HeLa cells shown in a–c, as well as for a similar experiment with a cav- GFP–transfected HeLa cell, and with GFP-cav-1 β- transfected A431 and MDCK cells, respectively. The colors correspond to the five bleach regions used. (e, g, i, and k) Corresponding, normalized fluorescence intensity in the bleach regions after bleaching (mean ± SD, n = 25 for each experiment). Bar, 2 μm.

