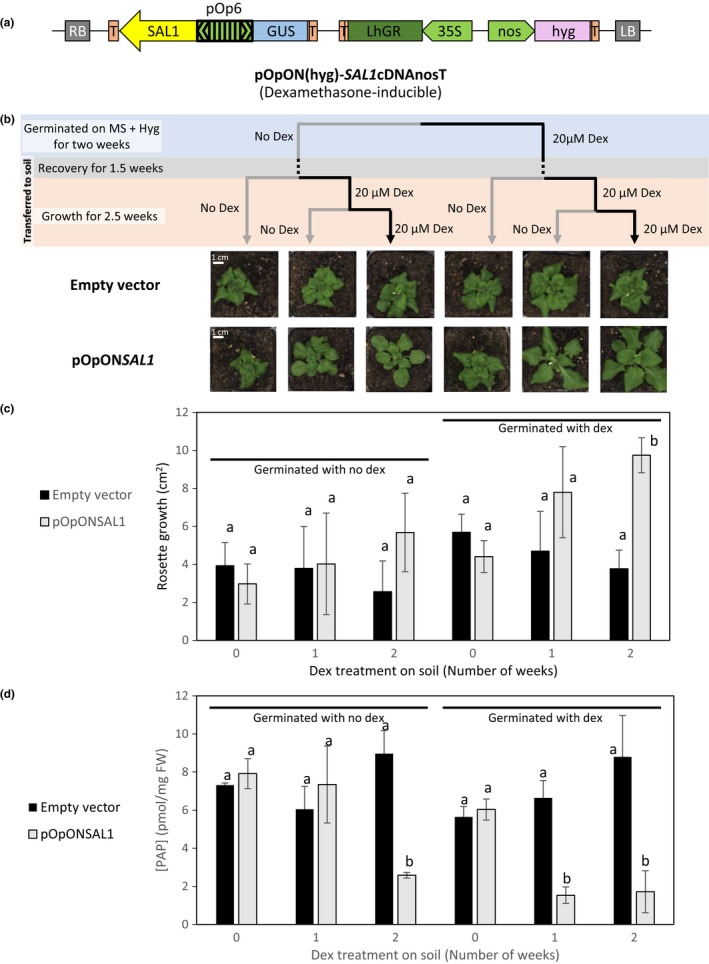
Figure 4.

Inducible‐SAL1 complementation of sal1‐6 using pOpON system for PAP manipulation. (a) Schematic diagram of the pOpON‐SAL1 [pOpON(hyg) as backbone] plasmid vector. RB, right border; T, terminator; hyg, hygromycin‐resistant gene; LB, left border. (b) T2 transgenic lines of pOpON empty vector and pOpONSAL1 were germinated under two different conditions: MS with hygromycin only and MS with hygromycin and 20 μM dex. After 2 weeks of growth on MS (blue phase), the plants were transferred to soil and let to adapt to growth on soil for 1.5 weeks (gray phase) before further dex treatment during growth on soil (orange phase). Representative images for both empty vector control and pOpON‐SAL1 transgenic lines at the end of the different dex treatment regimes are shown; scale bars indicate 1 cm applicable to all photographs. (c) The corresponding average rosette growth quantified during the 2‐week dex treatment on soil is shown. (d) 3′‐phosphoadenosine‐5′‐phosphate quantification of the T2 transgenics at the end of the different dex treatment regimes. Error bars indicate standard deviation while statistical differences are denoted by different letters (a, b) above each bar based on two‐way ANOVAs
