
Figure 2.
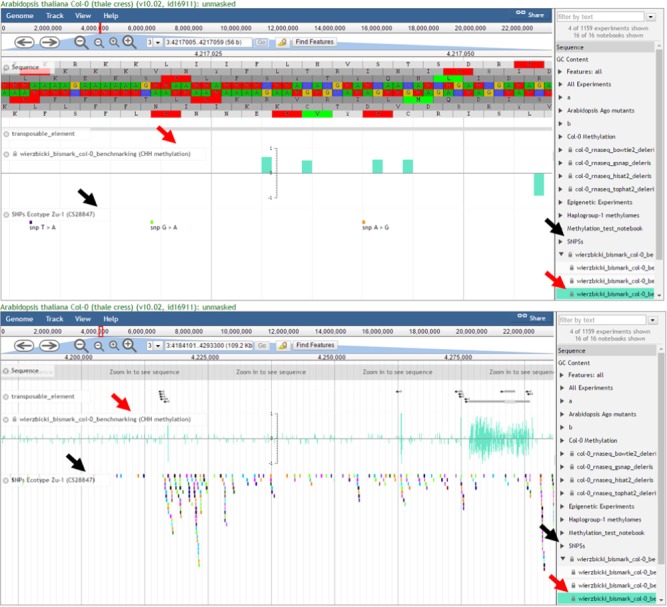
Data Visualization With EPIC‐CoGe. At the completion of a LoadExp+ workflow, data are viewed in CoGe's genome browser, EPIC‐CoGe (based on JBrowse). Experiments appear as selectable tracks within each notebook (right side). Shown here are private quantitative data (CHH methylation, red arrows) and public diversity data (SNPs, black arrows) displayed with annotated genomic features (transposable elements) and genomic DNA sequence. The upper and lower images display the same data at different scales to show both specific details (upper) and broad features (lower)