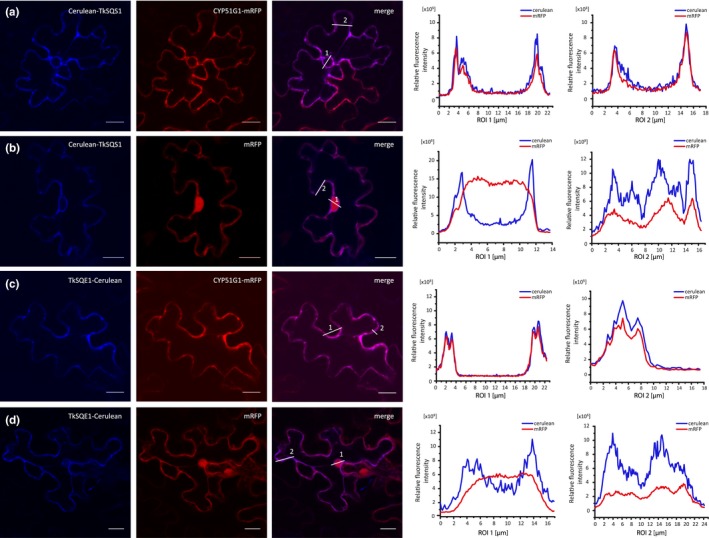
Figure 4.

Localization of TkSQS1 and TkSQE1. (a–d) The CLSM images show red (mRFP, excitation 543 nm) and blue (Cerulean, excitation 458 nm) fluorescence of fusion proteins expressed in Nicotiana benthamiana epidermal cells. The relative fluorescence intensity in each region of interest (ROI) is marked in two regions. NtermCYP51G1‐mRFP = ER‐localized marker containing a 120‐bp cDNA fragment representing the N‐terminus of Arabidopsis thaliana CYP51G1 sterol 14‐demethylase; mRFP = cytosolic marker; scale bar = 20 μm
