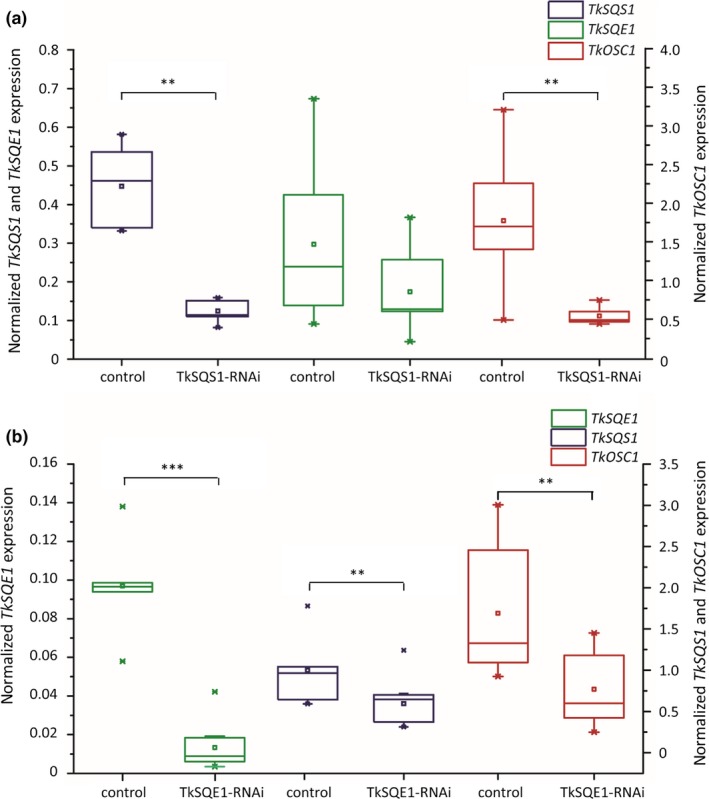
Figure 6.

TkSQS1, TkSQE1, and TkOSC1 mRNA expression analysis in latex from TkSQS1‐RNAi and TkSQE1‐RNAi Taraxacum koksaghyz plants. The corresponding mRNA levels were normalized against the constitutive genes encoding elongation factor 1α (TkEF1α) and ribosomal protein L27 (TkRP) from T. koksaghyz. The transgenic plants were analyzed 12 weeks after sowing. TkSQS1, TkSQE1, and TkOSC1 mRNA expression analysis in (a) TkSQS1‐RNAi plants (n = 10 from six independent lines) compared to control plants (n = 7) and (b) TkSQE1‐RNAi plants (n = 11 from four independent lines) compared to control plants (n = 6). Asterisks denote statistical significance compared to control (two‐tailed t test, ** = p < 0.01, *** = p < 0.001)
