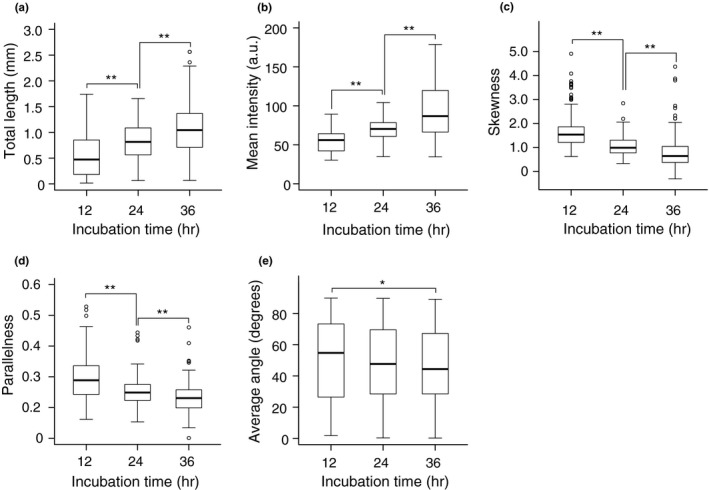
Figure 3.

Time course of changes in cellulose configuration metrics during cell wall regeneration in protoplasts. (a–d) Protoplasts were incubated for 12, 24, or 36 hr, and total length (a), mean intensity (b), and skewness of intensity distribution (c) were measured from confocal optical images. a.u., arbitrary unit. (d, e) Parallelness (d) and average angle (e) of the cellulose network in oval‐shaped protoplasts incubated for 12, 24, or 36 hr. Significance was determined by Mann–Whitney test. **p < .01. *.01 ≤ p < .05. n ≥ 131
