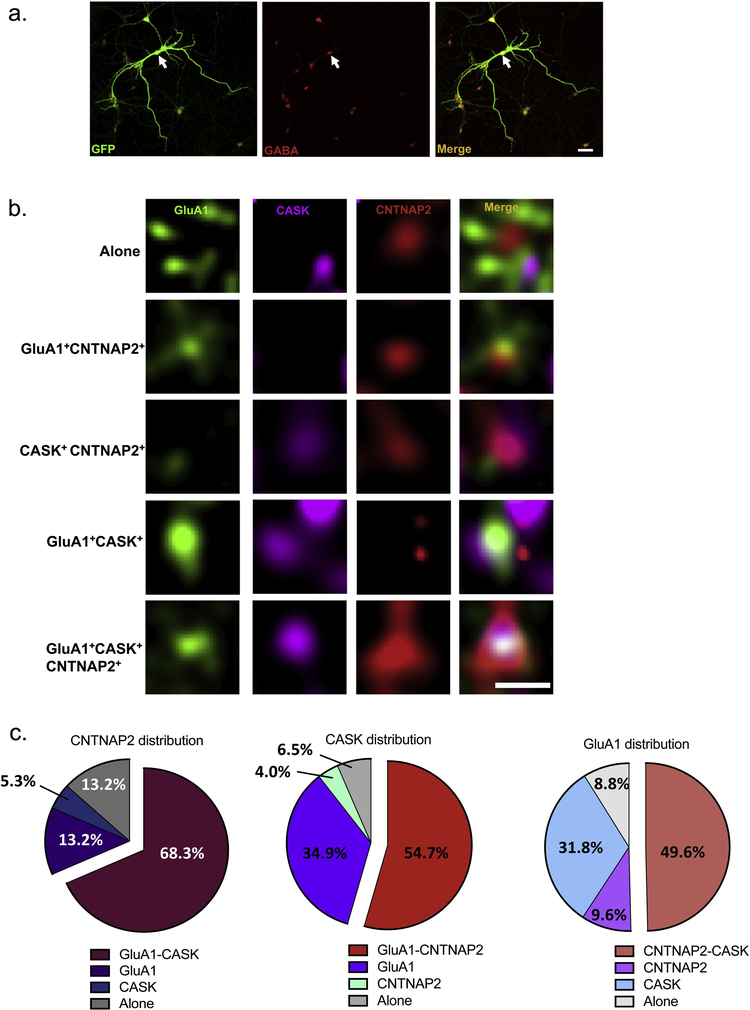
Fig. 2.
SIM reveals CNTNAP2, CASK, GluA1 most frequently form a tripartite complex. (a) Representative low-magnification confocal image of an interneuron, confirmed by co-staining with a GABA antibody (scale bar = 50 μ m). (b) Representative high-resolution SIM images displaying various distributions of endogenous CNTNAP2, CASK, and GluA in the dendrites of 27 DIV interneurons (scale bar = 0.5 μ m). (c) Categorization of the patterns seen in (b) (n = 98–135 total puncta from 12 branches and 3 independent experiments).

