
Figure 3.
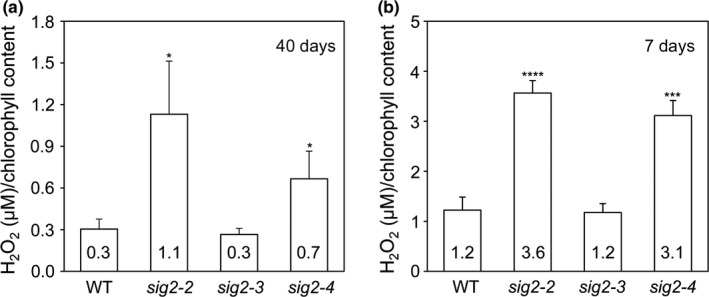
The measurement of H2O2 contents in wild‐type and sig2 mutants. The level of H2O2 was measured using Amplex Red assay and normalized to total chlorophyll content. (a) The level of H2O2 measured using three leaf disks from wild‐type (WT) and sig2 mutants grown on soil under white light (100 μmol m−2 s−1, long‐day condition with 8 hr dark/16 hr light cycle) at 22°C for 40 days. (b) The level of H2O2 measured using seedlings of WT and sig2 mutants (n = 27) grown on MS medium under constant white light (100 μmol m−2 s−1) at 22°C for 7 days. Data points in graphs represent mean (±SD, n = 4 biological repeats). Unpaired, two‐tailed Student's t test comparing sig2 mutants to Col‐0 WT, *p < .05, **p < .005, ***p < .0005, ****p < .00005