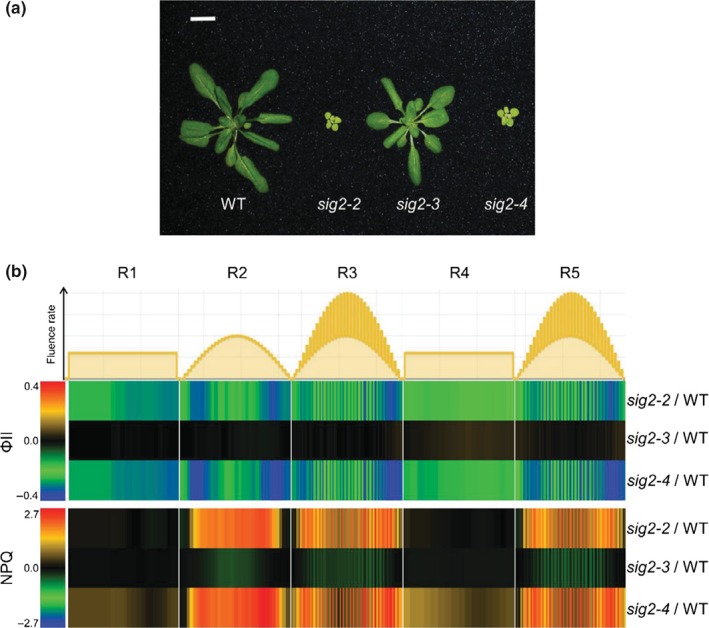
Figure 4.

ΦII and NPQ measurements in adult wild‐type and sig2 mutants. (a) Representative image of adult plants grown on soil under white light (100 μmol m−2 s−1, long‐day condition with 8 hr dark/16 hr light cycle) at 22°C for 30 days. The scale bar indicated 1 cm. (b) Heatmap showing the level of ΦII (photochemical efficiencies of PSII) and NPQ (nonphotochemical quenching), calculated from chlorophyll fluorescence images captured under five different light regimes (R1 to R5) during the course of 5 days using two‐week‐old plants grown on soil under white light (100 μmol m−2 s−1). R1, constant light (100 μmol m−2 s−1); R2, sinusoidal light with maximum 500 μmol m−2 s−1; R3, fluctuating light between two sinusoidal light intensity curves with maximum 1000 μmol m−2 s−1; R4 and R5, repeat R1 and R3, respectively. Difference between mutants and wild‐type (WT) was shown. Red denotes increased relative level of ΦII or NPQ in mutants compared to WT; blue denotes decreased level of ΦII or NPQ in mutants compared to WT
