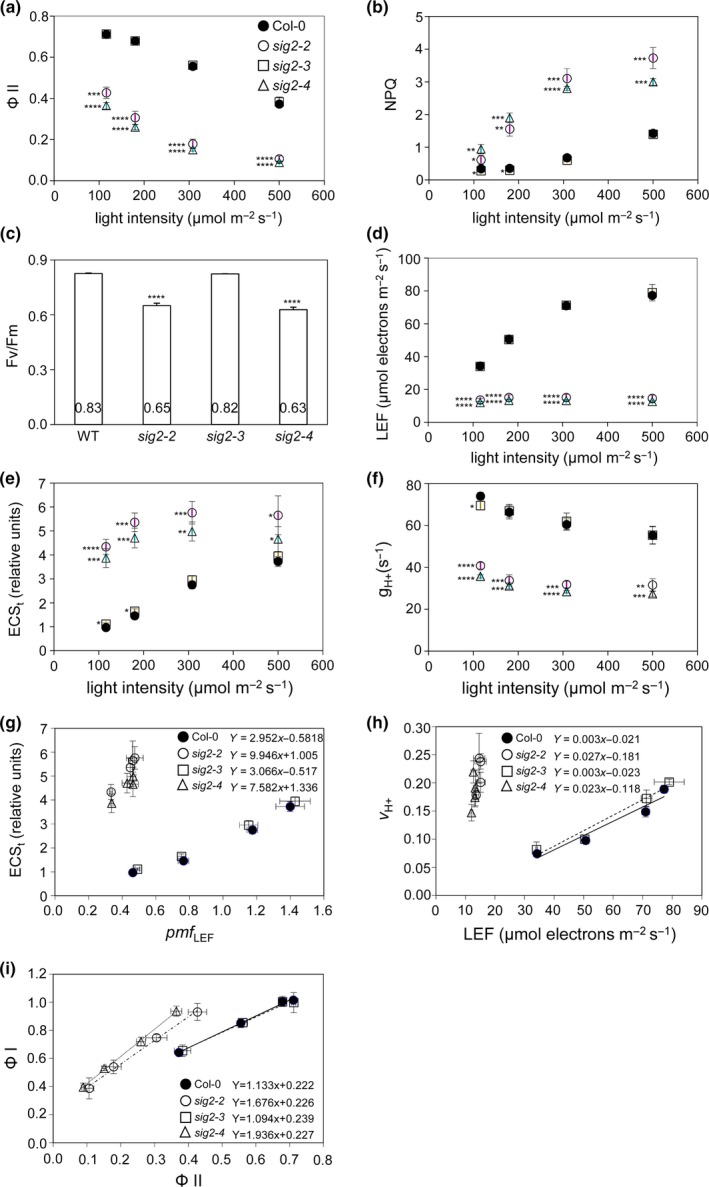
Figure 5.

Measurement of photosynthetic properties in wild‐type and sig2 mutants grown on soil. Plants were grown at 22°C under white light (100 μmol m−2 s−1, long‐day condition with 8 hr dark/16 hr light cycle) for 40 days. Undetached leaves from WT (filled circle), sig2‐2 (open circle), sig2‐3 (square), or sig2‐4 (triangle) were used for measurements of distinct photosynthetic properties. (a) ΦII (photochemical efficiency of PSII) vs. light intensity, (b) NPQ (nonphotochemical quenching) vs. light intensity, (c) maximal quantum yield of PSII (Fv/Fm), (d) LEF (linear electron flow) vs. light intensity, (e) ECS t (total magnitude of ECS decay) vs. light intensity, (f) (steady‐state rate of proton flux) vs. light intensity, (g) ECS t versus pmf LEF (pmf, generated solely by LEF), (h) CEF (cyclic electron flow) determined from slope of the linear regression of vs. LEF, and (i) PSI (ΦI) vs. PSII (ΦII). Data points in graphs represent mean (±SD, n = 3 individual plants). (a–f) Unpaired, two‐tailed Student's t test comparing sig2 mutants to Col‐0 WT, *p < .05, **p < .005, ***p < .0005, ****p < .00005. (G‐I) Linear regression equations are shown for each plant line
