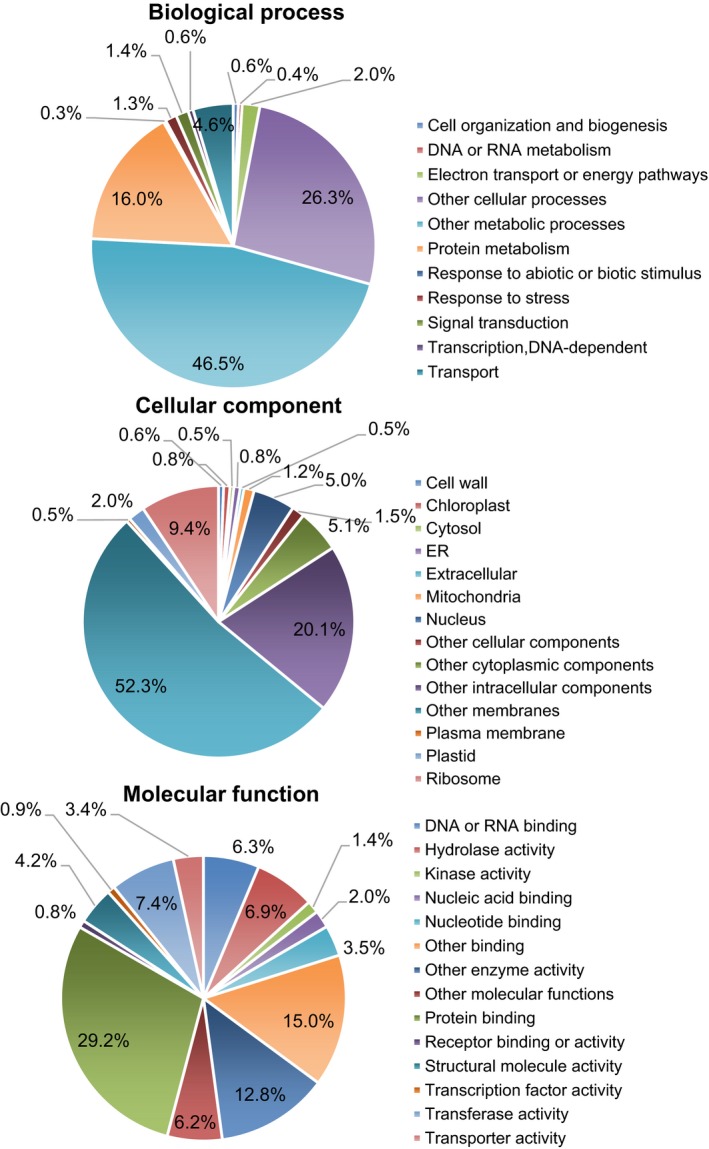
Figure 3.

Summary of the gene ontology analysis for the Nicotiana benthamiana ESTs. The distribution of gene ontology (GO) terms in three GO categories (biological process, cellular component, and molecular function) is shown in the pie chart. The number of GO terms is counted according to the heterologous BLAST search from Arabidopsis. The charts presented are based on information from tomato. All 4,117 EST sequences were used for the GO analysis
