Figure 8.

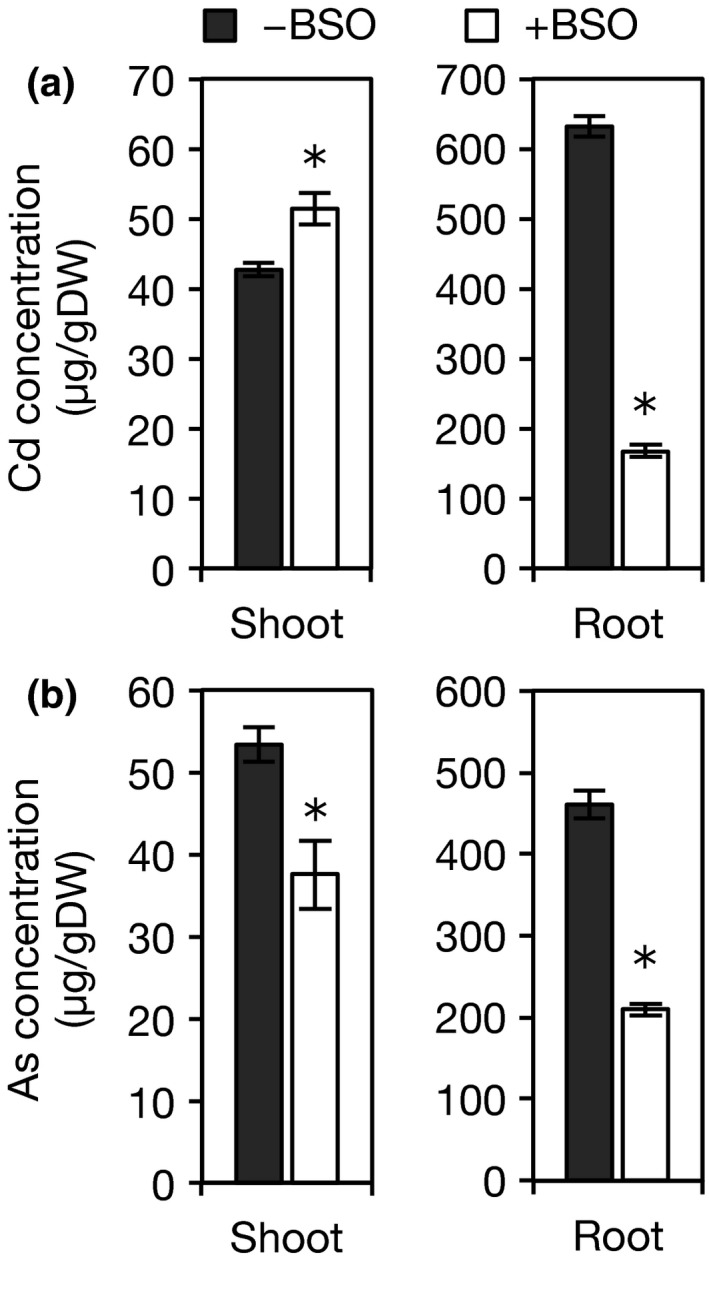
Effect of a GSH synthesis inhibitor on Cd and As concentrations. (a) Cd concentration in shoots (left) and roots (right). (b) As concentration in shoots (left) and roots (right). Seven‐day‐old seedlings of Nipponbare were transferred to a culture solution supplemented with toxic metals [10 μmol/L Cd or 10 μmol/L As(III)] either alone or in combination with 0.5 mmol/L BSO and grown for 7 days. Each plant was separated into shoots and roots and oven‐dried. After digestion with HNO 3 and HClO4, Cd concentration was analyzed by atomic absorption spectroscopy, and As concentration was analyzed by inductively coupled plasma atomic emission spectroscopy. Values are expressed as means ± SE (n = 5). An asterisk (*) shows a significant difference (p < 0.05, Dunnett test)
