
Figure 4.
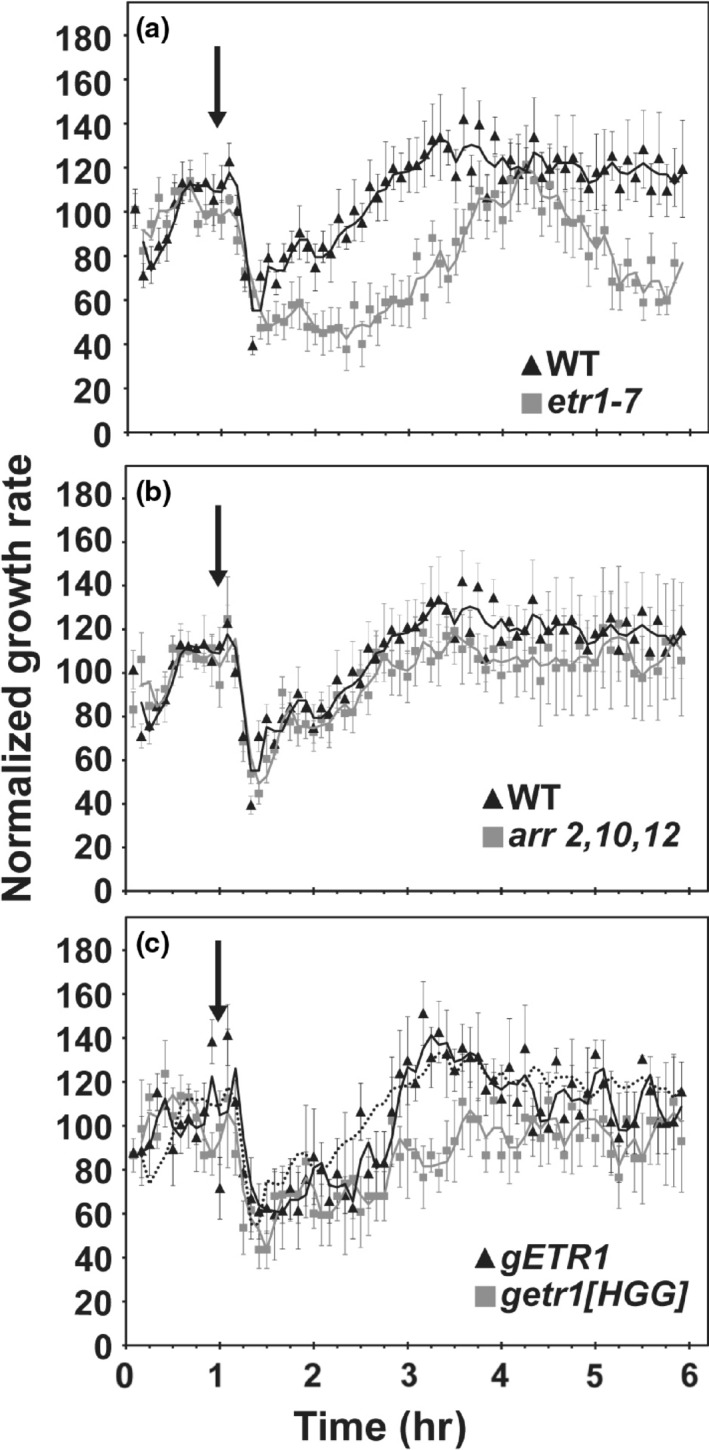
Kinetic analysis of the hypersensitive response to ethylene. Growth kinetic analysis was performed with 8.7 nl/L ethylene introduced 1 hr after measurements were initiated (down arrow). The hypersensitive response of etr1‐7 (a), arr2‐2 arr10‐2 arr12‐1 (b), and transgenic etr1‐7 ers1‐2 lines containing wild‐type ETR1 (gETR1), or kinase‐inactive ETR1 (getr1‐HGG) (c) are all compared to wild type. The dotted line in panel C shows data for wild type for comparison. Data were normalized to growth rate in air prior to treatment with ethylene to facilitate comparisons. Error bars indicate SE (n ≥ 4)