
Figure 2.
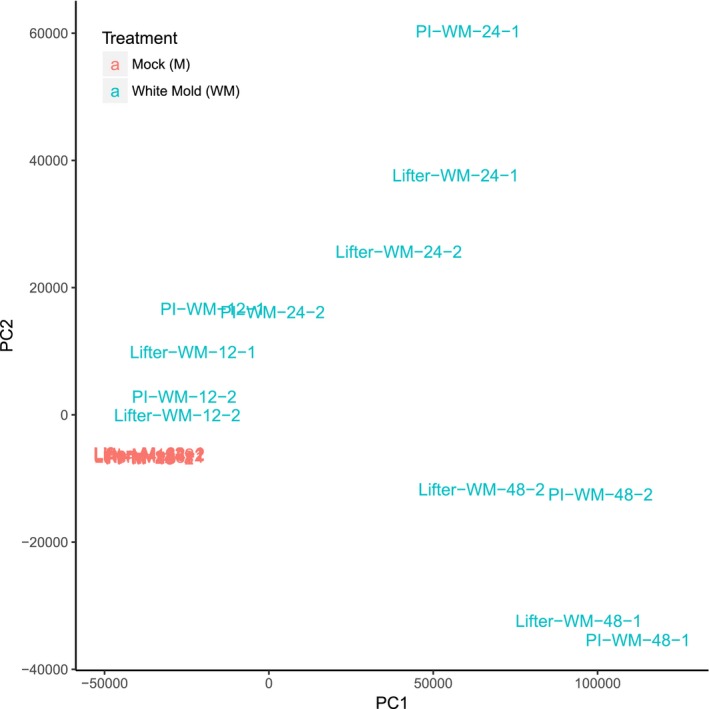
Principal component analysis (PCA). PCA defines the distribution of samples in an orthogonal system that maximizes variance explanation in the first and the second principal components (PC). PC1 explains about 75% of total variance from the RNA‐Seq gene expression among samples based on the normalized transcripts per million, and it is correlated with white mold (WM) inoculation as the plot clearly indicates separation of samples in the first axis. As mock inoculated samples are grouped tightly to each other, it is clear WM inoculation was the major influencing factor on gene expression. For Sclerotinia sclerotiorum‐inoculated samples, the time points appeared to be the second most influential factor