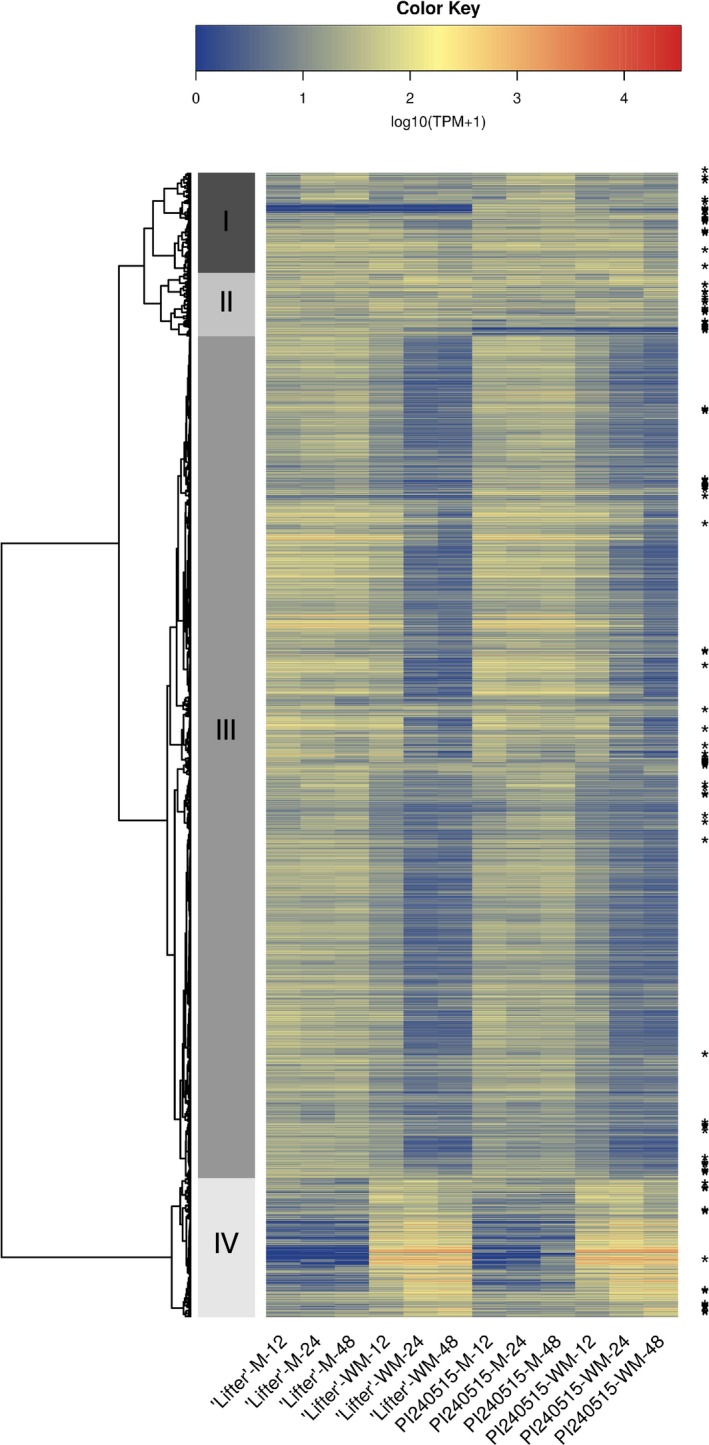
Figure 3.

Heatmap and clustering analysis for differential expression (DE) transcripts over time. Transcripts with an asterisk have significant DE between ‘Lifter’ and PI 240515 only in Sclerotinia sclerotiorum‐inoculated samples but not mock samples. Clustering analysis breaks the 17,220 transcripts into four clusters. Cluster III contains transcripts that are generally down‐regulated in S. sclerotiorum‐inoculated samples, and cluster IV contains transcripts that are up‐regulated in S. sclerotiorum‐inoculated samples. Although cluster IV has higher expression after S. sclerotiorum inoculation, a few transcripts displayed significantly higher expression in PI 240515 than ‘Lifter,’ indicating most of the transcripts in cluster IV may be involved in common responses to pathogen infection but not necessarily candidate resistance genes
