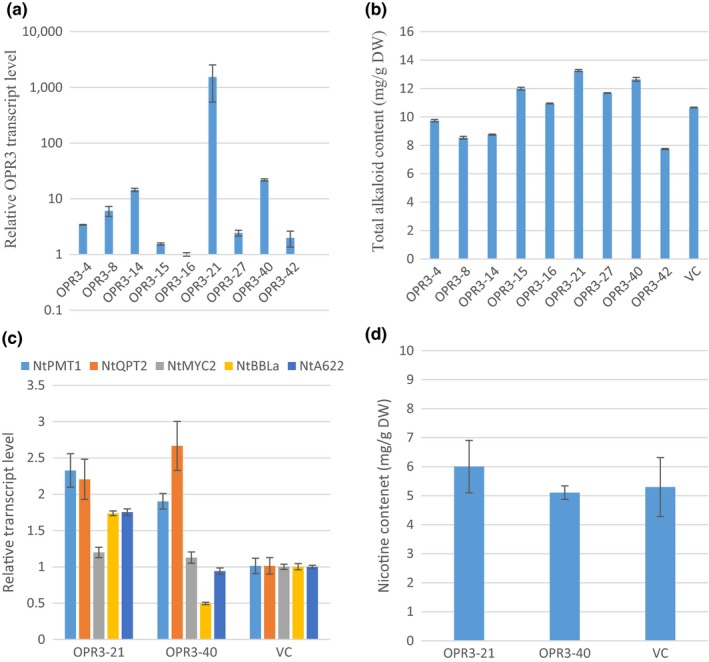
Figure 3.

Overexpression of AtOPR3 in tobacco. (a) Relative AtOPR3 transcript levels in OPR3 T0 transgenic plants. RNA was isolated from leaf tissues collected before topping. Transcript levels were determined by qRT‐PCR. Values are means from three technical replicates. AtOPR3 transcript levels were normalized to actin and presented as fold to the AtOPR3 level in OPR3‐16 plant which is arbitrarily set at 1. (b) Total alkaloid levels of OPR3 T0 plants. Total alkaloids were extracted and quantified from leaves 7 days after topping. The values shown are the means of total alkaloids (mg) per gram leaf dry weight from three technical replicates. (c) Transcript levels of five nicotine synthesis‐related genes in roots of two OPR3 T1 lines. Roots from three plants were pooled at preflowering stage. Transcript levels were determined by qRT‐PCR with three technical replicates. Transcript levels were normalized to actin and presented as fold to the vector control (VC) which was arbitrarily set at 1. (d) Nicotine content of two OPR3 T1 lines. Nicotine was extracted and quantified from leaves at preflowering stage. The values shown are the means of nicotine (mg) per gram of leaf dry weight from three biological replicates. VC, vector control. No significant difference was observed
