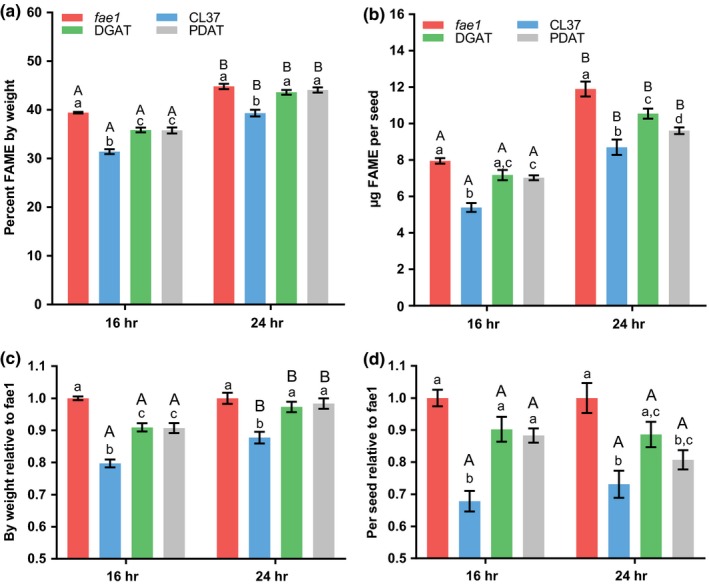
Figure 1.

Seed oil content of day/night cycle versus continuous light. Mature seed oil content from plants grown under a 16‐hr photoperiod and 8‐dark day/night cycle versus continuous 24‐hr photoperiod. Light intensity of 200 μmol photons m−2 s−1 for both light treatments. (a) Total seed lipid content as a percentage of seed dry weight. (b) Total lipid content per seed. Data represent average and SEM of 10–17 biological replicates for each measurement. (c) and (d) represent the relative lipid content of the transgenic with respect to fae1 in a and b, respectively. If letters above two bars are different, then there is significant difference between the two bars. Upper‐case letters compare the same line between light treatments; lower‐case letters compare each line within a light treatment
