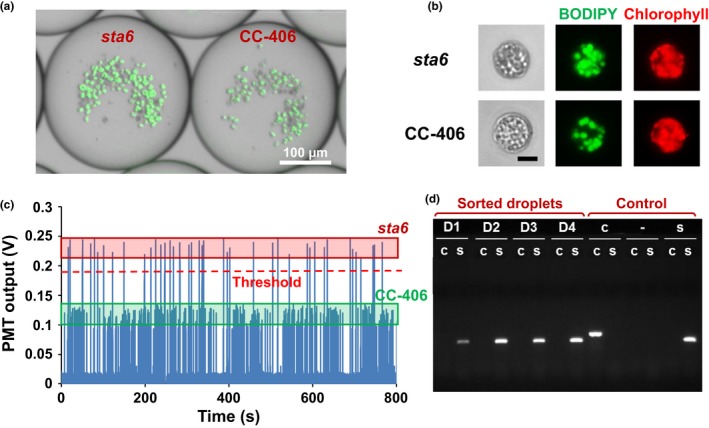
Figure 3.

Lipid content screening using CC‐406 and sta6. (a) Microscopic images of droplets after on‐chip BODIPY staining after 4 days of culture. (b) Enlarged view of CC‐406 and sta6 cells inside droplets. Scale bar = 5 μm. (c) Characterization of lipid content through BODIPY fluorescence detection illustrating the difference in optical signals from droplets harboring CC‐406 vs. sta6. (d) Genotyping PCR results confirming the sorted droplets with higher optical output contained sta6 cells. D1‐4: samples recovered from four sorted droplets; ‐: DNA‐free control; c: CC‐406; s: sta6
