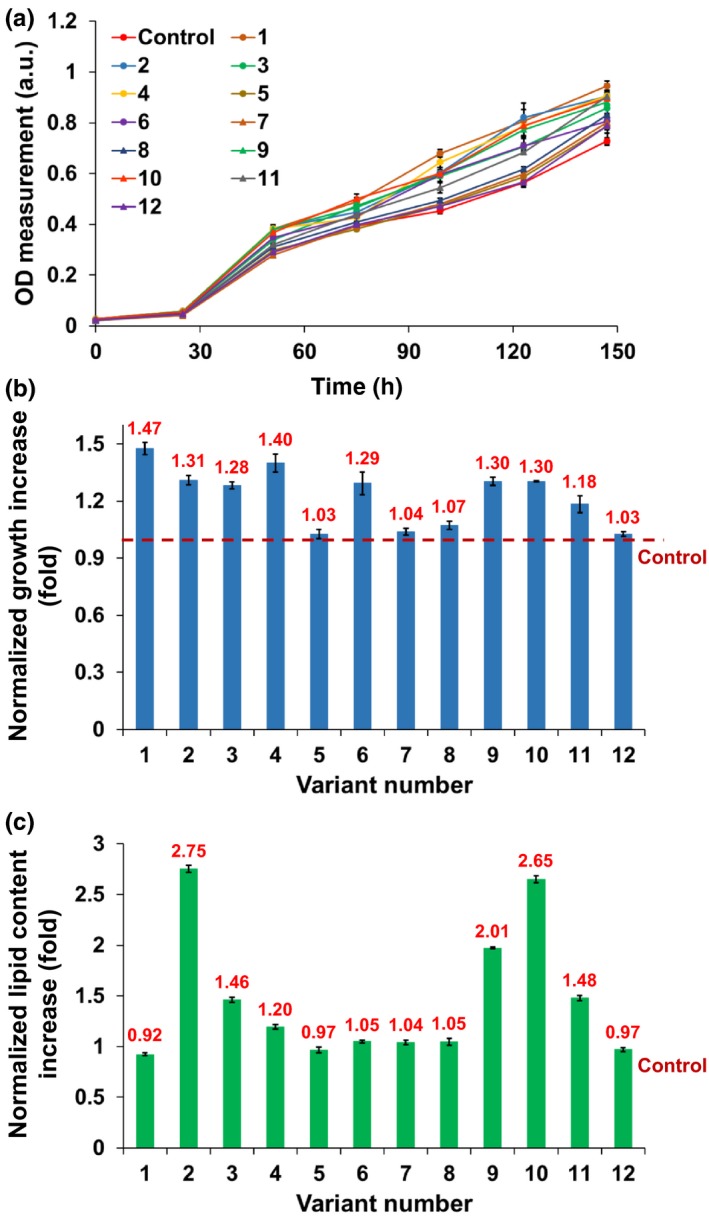
Figure 6.

Off‐chip characterization of growth and lipid content characteristics of the 12 selected variants using a six‐well culture plate. (a) Growth comparison of the variants to the control by tracking OD750 over 6 days (n = 3). (b) After 4 days of culture, seven variants (#1, 2, 3, 4, 6, 9, and 10) showed more than 30% higher growth than the control. Growth increase (ODday=4/ODday=0) of each variant was normalized to that of the control. (c) Comparison of lipid content measured by flow cytometry (n = 150). All data shown are mean ± standard error
